First appeared as Policy Brief PB 53/22 at the Policy Center for the New South
Also at Seeking Alpha, TheStreet.com, and Capital Finance International
Chinese economic figures released since August’s beginning have shown a slowdown in its growth. New Omicron coronavirus outbreaks in the context of the Covid-zero policy, the housing slump, and heat waves have been decelerating the economy’s pace.
China’s current growth slowdown is an additional step in the trajectory of gradually declining rates that has accompanied the “great rebalancing” since the beginning of the 2010s. One major difference now is the perception of exhaustion of waves of overinvestment in real estate and infrastructure as a lever, as compared to three previous moments since the beginning of the last decade.
China’s 2022 Economic Growth Deceleration
Chinese economic figures released at the beginning of August showed a slowdown in its growth. New Omicron coronavirus outbreaks in the context of the Covid-zero policy, the housing slump, and heat waves have been decelerating the economic recovery.
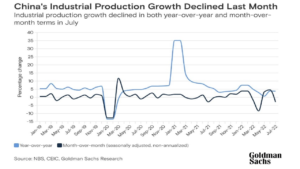
The economy started the year with strong momentum in January-February, but negative shocks led Gross Domestic Product (GDP) to have contracted by an estimated (seasonally adjusted annual) rate of 5.4% q/q in the second quarter. Industrial production grew just 3.8% in July from a year earlier, well below the expected 4.5% (Figure 1). GDP growth estimates by several international banks for the world’s second-largest economy this year were recently revised down to levels between 2.5 and 3.3%.
Figure 1
A scorching, and dry summer is stressing energy supplies and leading to production cuts in certain provinces and some energy-intensive sectors.
The crisis in China’s real estate sector continues to undermine economic performance. Housing is an important component of fixed investment. It grew by just 5.7% in the first seven months of the year, compared to the same period in 2021. Last year, that number was 10.3% higher year-on-year from July on.
Property sales are expected to decline by about 7% and construction starts to fall about 30%, in annual terms, in the second half of the year (Yao, 2022). The real estate slowdown since last year was initially driven by the policy choice to reduce ‘developers’ leverage and achieve a long-term housing objective “for housing, not for speculation”. Banks, regulators, and local governments will have to stick to this policy objective and a general bailout is not on the cards. There is an expectation that adjustments to the balance sheets of companies and customers/suppliers in the sector will occur without resulting in systemic crises, despite occasional defaults and bankruptcies.
Financial stress on highly indebted property developers has increased over the past couple of years. Many developers have been unable to refinance in bond markets for most of 2021, and several significant developers have either negotiated repayment extensions with creditors or defaulted outright. As shown by Zhang (2022), many creditors have agreed to negotiate repayment extensions ahead of potential defaults to give developers more time to avoid them (Figure 2).
Figure 2 – China: developer bond repayment bond issues are not getting better
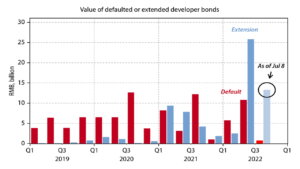
Source: Zhang, X. (2022). The Financial Stress from Property Spreads, Gavekal Dragonomics, July 13th.
The impact of the Omicron wave on China’s economic growth was significant, especially in regions subject to COVID-related lockdowns. In turn, retail sales in July were up just 2.7% year-on-year, far below expectations of 5%. New outbreaks of Omicron and the risks of confinement due to being in the wrong place and time, in addition to affecting retail trade, also did so in the case of domestic tourism.
Since 2020, household consumption has remained weak, persistently staying below the 2017-19 trend (Gatley, 2022). The labor market has been very soft, and that does not help.
Strictly speaking, only exports maintained a good pace (Figure 3). Trade has recovered faster than domestic activity since the reopening first started with streamlining logistics and transportation, especially for trade-related activities. Additionally, production and investments are outpacing consumption and services, as factory reopening has been a higher priority than the relaxation of individual mobility restrictions.
Factory activity has come back more quickly than many expected, with exports posting their highest growth rate in a year in June. In contrast, indicators of the purchasing decisions of households have lagged. As approached below, such a pattern runs against the “rebalancing” pursued by Chinese authorities since the beginning of the last decade.
Figure 3 – Exports aside, the rebound of lockdowns has been very lackluster
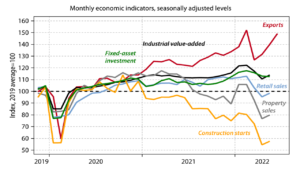
Source: CEIC, Gavekal Dragonomics Macrobond, July 14th, 2002 (Thomas Gatley, Webinar on China).
Despite the slowdown, the measures taken by the government to counter it can be considered modest, unlike other moments in recent history. The People’s Bank of China cut two major interest rates in mid-August – the repo interest rates on one-year and seven-day open market operations – by… 10 basis points! On August 22nd, it announced a 15bp cut in the five-year interest rate, lowering it to 4.30%, while the one-year rate was reduced by another 5bp to 3.65%.
Analysts do not believe such rate reductions – and other newly announced incremental fiscal measures – could significantly boost economic growth. The increases in the monetary base (M2) since last year have not been accompanied by an equivalent expansion of domestic credit (Figure 4), denoting the presence of dampening factors underlying the slowdown in investments – certainly in the real estate area, given the fragile situation of firms in the sector and the demand for its products.
Figure 4 – China: credit and M2 money supply
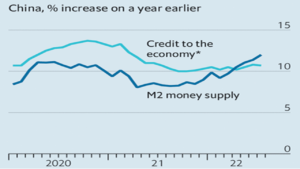
* Total Social Financing – Source: The Economist, August 18th, 2022
China’s Great Rebalancing
To understand where Chinese economic growth is, it is necessary to go back to the beginning of the last decade. In December 2011, when I was one of the vice presidents of the World Bank, I attended a ceremony in Beijing in which then-President Hu Jintao made one of the first statements on the need for an inevitable “rebalancing” of the Chinese economy (Qingfen and Ran, 2011).
There would have to be a gradual redirection towards a new pattern of growth, in which domestic consumption should increase in relation to investments and exports, while an effort would also be made to consolidate local insertion up the ladder of value added in global value chains. Services should also increase their weight in GDP relative to manufacturing. China would no longer have the double-digit GDP growth rates of previous decades (Figure 5), but growth would no longer be, as Premier Wen Jiabao had said in 2007, “unstable, unbalanced, uncoordinated and unsustainable”.
Figure 5 – China: annual GDP growth rates
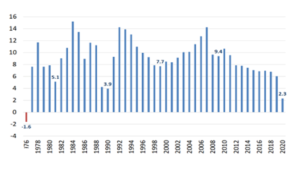
Source: CEIC
High and sustained GDP growth rates had been based on elevated investment-to-GDP ratios – which were only possible with low shares of wage income and domestic consumption, as well as with cheap and repressed finance (Canuto, 2019a).
Another factor was dynamic markets abroad willing and capable of absorbing an expansion of Chinese exports – something that could not happen indefinitely, given the size acquired by China’s economy. The combination of high investment and low domestic consumption (a flipside of high profits relative to wages) was only possible because of current account surpluses in trading with the rest of the world.
Growing income disparities were a domestic flipside of that model, a potential source of social strain along with changes in the external environment.
Three mutually reinforcing paths of transformation were seen ahead in 2011, with a structural growth slowdown on the cards.
First, those gains had, to a large extent, already happened. China accrued significant productivity increases through transferring resources from low-productivity agriculture activities to industry — a typical feature of economies moving from low- to middle-income levels (Canuto, 2019b). On the demographic front, the old-age-dependency ratio had started to rise. Gains in economic efficiency and technological progress – based on the absorption of existing, imported technologies – would have to be increasingly replaced with local innovation. The set of second-generation policy reforms necessary for that would require time. In contrast, low-hanging fruits would become less available.
As the second path of change, a rebalance in the sector structure and aggregate demand composition was expected. Higher shares of services and consumption, following rising wages, with a decrease in exports, savings, and investment ratios-to-GDP, should accompany the increased reliance on domestic sources of aggregate demand.
The income gap between coastal areas – where special zones were created and extended- and middle and western regions should fall as the labor pool shrank. Despite lower GDP growth rates due to lower investment-to-GDP ratios and total factor productivity increases being harder to obtain, the popular perception of rising prosperity would probably be higher than before, with increasing purchasing power by the population.
The third path of structural transformation would be a shift up the value chain in tradable and non-tradable activities. That should underpin the directions of change in the sector structure and components of aggregate demand. A transition to more sophisticated production processes was already being pursued.
While moving to a less spectacular growth trajectory, China would morph into a mass-consumer market economy, combined with supply capacity increasingly reliant on the growth of “total factor productivity”.
Having a clear roadmap did not mean an easy ride. Given the low level of domestic consumption in GDP (a fact that is still present) and, therefore, the dependence on investments and trade balances, the transition would run the risk of experiencing an abrupt drop in the pace of growth, particularly given the context after the crisis 2008-09 global financial crisis. Waves of credit-driven overinvestment in infrastructure and housing followed to allay fears of an abrupt sharp downturn.
The second round of such overinvestments came into play in 2015–2017 in response to a real estate downturn and a stock market decline. In addition, there were expansion policies adopted during the pandemic crisis in 2020.
Indeed, a decline in Chinese GDP growth rates gradually took place, to 6% in 2019, towards levels such as the 4% expected after the pandemic (Figure 5). And the gradual rebalancing toward reducing dependence on investment and trade surpluses can be seen in Figures 6 and 7.
The left-hand panel of Figure 6 depicts how domestic demand started shifting away from investment and towards consumption. In contrast, the right-hand panel, on the production side, shows services outgrowing manufacturing as the production structure became more complex, integrated, and with higher value added.
However, and that is a challenge, the transition toward a less investment- and export-dependent growth model has been taking place from a starting point of exceptionally low consumption-to-GDP ratios compared to the rest of the world. No wonder rebalancing toward a consumption-based growth model was expected to be only gradually pursued, as GDP growth rates might collapse rather than slide down. The change in growth pattern would require time-intensive structural reforms.
Figure 6 – China’s rebalancing toward consumption and services
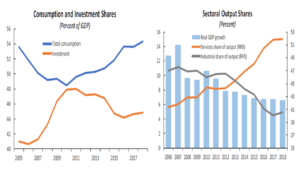
Source: Aasaavari, N. et al (2020).
The left-hand panel of Figure 7 displays the decrease of the role played by current-account surpluses with the rest of the world as part of China’s growth rebalancing. 2020 was a point off the curve. China’s current-account surplus narrowed in Q1 but widened again to 1.5% of GDP over four quarters ending in Q3, reflecting a more robust trade balance and a collapse in outbound tourism. The right-hand panel shows how rebalancing towards consumption regressed as public investment drove the 2020 first phase of after-pandemic recovery… and the reopening after the Q1 lockdown favored industrial activity.
Figure 7 – China’s rebalancing toward less export-dependence
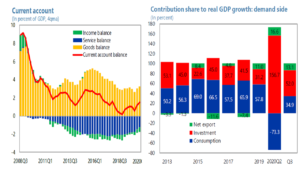
Source: IMF (2020).
A harder question to answer concerns how the gradual evolution of GDP growth and changes in composition since 2010 would have been in the absence of the waves of infrastructure and real estate overinvestment, counting only on the “rebalancing”, that is, an increase in wages and mass domestic consumption and the transition to greater weights of services and higher technology.
This matters insofar as there is an ongoing perception that the real estate and infrastructure over-investments as a growth lever have depleted. Not only because of the levels of indebtedness – particularly via local government financing vehicle debt (LGFVs in Figure 8) that followed its extensive use but also because, at the margin, its returns in terms of GDP growth showed a declining contribution. Chinese authorities are now choosing to safeguard their economy from financial vulnerabilities, even at the price of GDP growth below official targets.
Figure 8 – China’s total government debt, by source 2013–2021 (Est.)
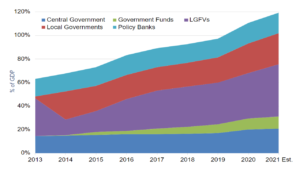
Source: Borst (2022).
Growth Challenges Ahead
The share of domestic consumption to GDP remains exceptionally low, which remains a challenge for China’s economic rebalancing. In addition to the high proportion of profits concerning wages, low levels of public spending on the social safety net have led to high household savings. As depicted on the left-hand panel of Figure 9, the coverage of the unemployment insurance system is still minimal, providing a range for only one in three people in the urban labor force and fewer than one in five migrant workers. Coverage is even thinner in rural areas. Only 10 percent of 23 million unemployed workers received benefits in 2016 (IMF, 2020).
Spending on social assistance and public health care is low. China’s aggregate welfare and health expenditures are only about 3.5 percent of GDP, much less than the average of more than 6 percent of the GDP of its emerging market peers (Figure 9, right-hand panel).
Figure 9 – Unemployment insurance coverage and social assistance spending
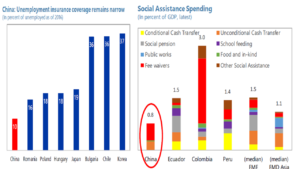
Source: IMF (2020).
Another challenge will be in climbing the technological and value-added ladder. Previously, to some extent, China resorted to policies of forced transfers by those who wanted to invest there or use technologies without recognizing intellectual property. On the other hand, it has, at the same time, also done its homework in terms of investments in education, infrastructure, etc., to absorb this technology creatively (Canuto, 2018).
In priority sectors, firms have continued to increase their capital expenditure. China has now reached the top of the ladder in many sectors, where “tacit and idiosyncratic” technology content must be developed locally, as it is not available simply by using or adapting existing technologies (Canuto, 1995). Furthermore, the “new normal” of the global economy after the pandemic and rising geopolitical risks since the war in Ukraine tend to exhibit an environment less friendly for China’s delving into technology abroad (Canuto, 2022).
China should also resume the rebalancing between public and private companies (SOEs and POEs) in service sectors, in which – not by chance – Chinese productivity remains well behind the border in advanced countries (Figure 10, right-hand panel).
Figure 10 – China’s rebalancing: SOEs and POEs
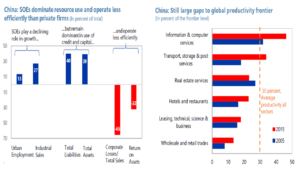
Source: IMF (2020), People’s Republic of China, Staff Report for the 2020 Article IV Consultation, November
In 2011, Chinese authorities referred to a “rebalance between public and private sectors” as “rebalancing”. But such rebalance has stalled, and progress in reforming SOEs has seen limited progress. Credit is still preferentially channeled to state businesses, which enjoy implicit guarantees. Competition between private firms and State-owned enterprises remains uneven in sectors where these SOEs were thought to open space. While large state-owned banks keep lending to SOEs, infrastructure and real estate investments were supported by shadow finance.
SOE deleveraging has paused, reflecting, in part, the pandemic crisis and the resort to them to support growth. That may have been an extraordinary policy option. What matters here is to call attention to the fact that the performance indicators on the left-hand panel of Figure 10 suggest that the absence of significant reform of SOE businesses has come at a cost in terms of productivity and real returns foregone. According to IMF (2020), even among listed firms, the average productivity gap between SOEs and private enterprises across sectors in China is about 20 percent.
China has seen remarkable growth over the last decades, but average sectoral productivity remains at about one-third of the global frontier. Productivity gaps are huge in the services sector. For example, business services productivity stands at only 17 percent of the frontier level, largely because of high entry barriers. Reforms addressing these gaps would include further opening non-strategic sectors such as services to the entry of new private firms—both domestic and foreign. Removing regional regulatory barriers would also help increase competition and improve factor allocation by facilitating firm entry and mobility across regions in all sectors.
These productivity gaps have significant implications for the level of GDP considering the SOE sector’s dominance in the use of resources. IMF (2020) refers to a staff analysis suggesting that reforms closing productivity gaps between SOEs and POEs across sectors could raise output by around 4 percent over the medium to long term.
Finally, it is worth recalling the debt legacy of the 3 previous waves of overinvestment in housing and infrastructure. Safeguarding against financial crashes will mean less use of them to boost growth ahead.
Bottom Line
The trajectory of China’s economic growth will remain sliding toward lower levels. In the coming years, the rest of the world can no longer count on China as an engine of growth as exuberant as it has been in recent decades. Given the size acquired by its economy and its growth rates at the margin, it will remain, though, as a fundamental component of the global economic dynamics.
References
Aasaavari, N. et al. (2020). China’s Rebalancing: Opportunities and Challenges for LAC Exporters, IMF Working Paper WP/20/239, November.
Borst, N. (2022). The Balance Sheet Constraints on China’s Economic Stimulus, SEAFARER, August.
Canuto, O. (1995). Competition and endogenous technological change: an evolutionary model, Revista Brasileira de Economia – RBE, EPGE Brazilian School of Economics and Finance – FGV EPGE (Brazil), vol. 49(1), January.
Canuto, O. (2018). Climbing a tall knowledge ladder, Policy Center for the New South, May 10th.
Canuto, O. (2019a). China’s Growth Rebalance with Downslide, Policy Center for the New South, Policy Brief PB-19/07, March.
Canuto, O. (2019b). Traps on the Road to High Income, Policy Center for the New South, Policy Brief PB-19/14, April.
Canuto, O. (2022). Slowbalization, Newbalization, Not Deglobalization, Policy Center for the New South, June 1st.
Gatley, T. (2022). July 14th webinar: China, Gavekal Research.
IMF (2020), People’s Republic of China, Staff Report for the 2020 Article IV Consultation, November.
Qingfen, D. and Ran, Y. (2011). ‘Opening-up to continue’, Chinadaily, December 12th.
Yao, R. (2022). The Construction Recession Deepens, Gavekal Dragonomics, August 11th.
Zhang, X. (2022). The Financial Stress From Property Spreads, Gavekal Dragonomics, July 13th.
Otaviano Canuto, based in Washington, D.C, is a senior fellow at the Policy Center for the New South, a professorial lecturer of international affairs at the Elliott School of International Affairs – George Washington University, a nonresident senior fellow at Brookings Institution, a professor affiliate at UM6P, and principal at Center for Macroeconomics and Development. He is a former vice-president and a former executive director at the World Bank, a former executive director at the International Monetary Fund, and a former vice-president at the Inter-American Development Bank. He is also a former deputy minister for international affairs at Brazil’s Ministry of Finance and a former professor of economics at the University of São Paulo and the University of Campinas, Brazil.