Otaviano Canuto, Matheus Cavallari and Tiago Ribeiro dos Santos [1]
Policy Center for the New South – Policy Paper PP-19/10
Multilateral Development Banks (MDBs) have two financing windows, with different terms, dedicated to low- and middle-income countries. Countries are presumed to cross those windows as their income per capita rises, with middle-income countries (MICs) eventually “graduating” to a non-client status once they reach some criteria. However, due to what may be called “middle-income traps”, such progression toward graduation has been limited to a small number of countries.
In this paper, we suggest areas where the support by MDBs would yield highest results toward “graduation” of MICs. Item 1 reviews the criteria that have been used to justify graduation, whereas item 2 approaches two ways by which the possibility of “middle-income traps” impeding such graduation has been discussed in the literature. Finally, item 3 proposes an interface between MDBs’ support to MICs and the policy agenda to overcome middle-income traps.
- Graduation redux
MDBs have different financing windows for low-income countries (LICs) and MICs, for which different country eligibility criteria are applied. Besides levels of income per capita, both the availability and terms of country access to international financial markets are also considered in the definition of which window a country is to be situated as a potential financial resource taker.
Those financing windows differ in terms of implicit subsidies. While financing to LICs carry high degrees of concessionality – corresponding to grants or finance with very low interest rates and long maturities – the subsidies embedded in financing MICs conceptually correspond to the difference between interest rates charged by MDBs and financial markets. MDBs are capable of typically offering finance at lower prices than – or close to – markets because of their ability to raise funds at very low costs, as a reflection of the “preferred creditor status” enjoyed by their operations, the “callable capital” pledged by shareholders [2] and the high levels of capitalization.
Thresholds of income per capita and country-specific classifications per window are periodically reviewed. For instance, in the case of the World Bank Group, which we use here as a reference for MDBs, the soft-loan window for LICs – International Development Agency (IDA) – implemented a graduation policy review in 2016 to be followed in the IDA18 3-year round of pledges by donors (World Bank, 2016).
In the case of the World Bank’s lending for MICs – the International Bank for Reconstruction and Development (IBRD) – the Articles of Agreement contain broad references to country eligibility and to graduation criteria, referring to capital availability at reasonable or suitable conditions—articles I (Purpose) and III (Conditions on which the Bank may Guarantee or Make Loans) (World Bank, 1944). Over the years, the interpretation of those references has served as a basis for IBRD graduation policy.
For example, according to a 1982 President’s Memorandum on the subject, two conditions would justify an IBRD member’s graduation: the level of development and overall economic situation, and the capacity to sustain long-term development process without relying on financial support from the Bank. This memorandum was followed by a statement by the Board of Executive Directors in 1984 to further clarify the discussions about eligibility. The substantive factors underlying such process would be reached by assessing three factors:
- the country’s ability to access external capital markets on reasonable terms;
- the progress in the establishment of key institutions for economic and social development;
- the achievement of a minimum level of GNI per capita (currently equivalent to US$7,000).
The 1984 Board statement clarified that member countries would not automatically lose access to IBRD lending by reaching such GNI per capita level, and only by reaching all substantive factors. After those understandings, repetitive interactions among Bank Management and Executive Directors have broadly agreed that the graduation policy has been sufficiently flexible to underlie appropriate graduation decisions.
Since 1973, 17 countries went through the IBRD graduation process [3]. Five of those later reversed their graduation (Iraq, Gabon, Trinidad and Tobago, Republic of Korea, and Venezuela), and only 1 re-graduated in 2016 (Republic of Korea). Currently, 74 countries have financial obligations with the IBRD.
Chart 1 depicts levels and composition of outstanding lending commitments of some MDBs to different country income groups. Different shares by income groups in each MDB’s balance sheet reflect differences in “missions” and in regional exposure of each institution.
Chart 1 – MDB loans by country income category (2016-2017)
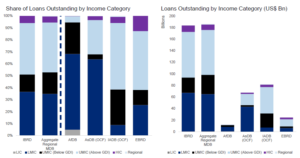
Source: WBG Finances, IBRD Statement of Loans by Country as at 30-September, 2017. Annual reports for AfDB, AsDB, IADB and EBRD for year ending 31-December 2016. Analysis by World Bank using World Bank FY2018 income classifications.
Knack et al. (2012) used different econometric specifications and found empirical evidence that both income and non-income factors have been significant determinants of IBRD graduation. On the upgrade side, the determinants are: income relative to graduation threshold, length of time above this threshold, institutional quality and creditworthiness. On the downgrade, the occurrence of crises and being a small country have also mattered. These findings suggest that the graduation policy has been applied in a consistent manner.
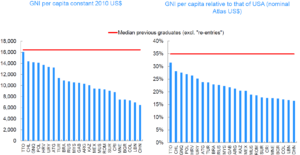
Another way to look at the historical evolution of the graduation process is by assessing each of the graduation criteria. The GNI-per-capita threshold was first adopted at US$1,000 in 1973, as a proxy for structural development. This level was later updated in 1980 to US$2,650, being annually updated for price changes and exchange rates, without additional discussion about its meaning in terms of structural development. While in 1982 this threshold represented 110 percent of the world average income and 29 percent of the average GNI per capita of high-income countries, in 2015 it had dropped to only 67 percent and 17 percent, respectively. Additionally, the median GNI per capita income of graduated countries, excluding the cases of reversion, is above US$16,000 at 2010 prices (Chart 2). [4]
Chart 2
Source: World Bank Indicators
The next criterion, access of external capital markets on “reasonable terms” can be approached with a comparison of the level of sovereign bond spreads vs. the IBRD spreads for those countries with GNI per capita above the income threshold. As one would suspect, sovereign spreads have a closer link to creditworthiness than to GNI per capita, especially for upper middle-income countries. In other words, sovereign spreads vary considerably for similar levels of GNI per capita (Chart 3). Furthermore, access to capital markets shifts often and abruptly during crises, which would make the assessment of “reasonable terms” a complex task, even for high-income countries – e.g. during the global financial crisis in 2007-09 or the European debt crisis in 2010.
Chart 3
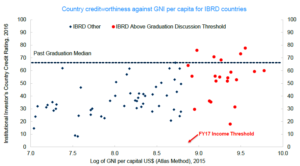
Source: World Bank Indicators and Institutional Investor, Inc.
As for the third criterion, the comparison of GNI per capita and institutional strength shows that similar levels of per capita income may be associated with substantially different levels in quality of institutions (Chart 4a and 4b).
Chart 4a
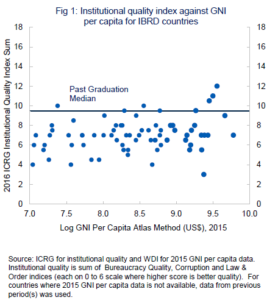
Chart 4b
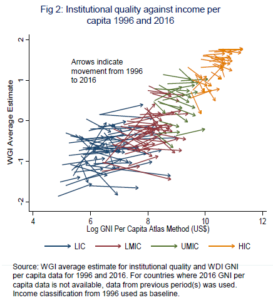
One may therefore notice how flexible and inevitably somewhat discretionary tends to be any country-specific use of the set of criteria for IBRD graduation.
A new round of intensive discussion around graduation of MICs is poised to take place in the near future. Last year, when World Bank governors agreed on a capital increase package for IBRD, it was announced that the institution “commits to a more systematic application of its graduation policy” (Development Committee, 2018). Interactions shall occur in the periodic strategic discussion between IBRD and every client member country, once the country achieved the above-mentioned income threshold. Such strategic engagement shall focus on strengthening policies and institutions to sustain development, aiming at ultimately resulting in its graduation.
A diverse range of views is at stake (Canuto, 2019a). On one extreme, one may point out the view in favor of MDBs narrowing lending windows and moving toward providing grants wherever applicable (e.g., Meltzer (2000)). More moderate views on focusing access to IBRD finance go from a strict enforcement of income -based graduation to charging higher interest rates and capping the lending space to those MICs with income above graduation levels—without taking into account other criteria. The latter two features were ultimately included in the terms agreed in the 2018 IBRD capital increase agreement.
On the other hand, several arguments in favor of a cautionary approach to graduation of MICs can also be pointed out: While lending to MICs with above-graduation levels of GNI per capita may dispute the use of scarce lending space with below-graduation MICs, the favorable composition of risk-adjusted returns obtained with the former may also crowd in lending space and minimize capital replenishments.
Secondly, a differential factor of MDB lending vis-à-vis market finance is the knowledge content embedded. In some cases even MICs with cheaper access to foreign credit opt for using it. While those who lean in favor of graduation refer to the possibility of MICs purchasing technical assistance from MDBs, instead of borrowing, there is also a feedback loop for MDBs in terms of “learning by operating” with these countries. The “hummingbird” role played by MDBs, pollinizing knowledge throughout the whole range of non-advanced economies, might lose one of its major learning sources (Canuto, 2019b).
Thirdly, the role played by MDBs in the provision of global public goods benefits from having a set of tools to interact with all MICs, which includes financial operations. As of 2015, member countries of IBRD with GNI per capita above the graduation level hosted 30 percent of the world population and 33 percent of the world GDP in PPP terms. Their carbon emissions increased from 31 percent as a share of the world’s during 2002-04 to 41 percent during 2011-13, while hosting 9.9% of global poor in 2013, considering US$ 3.1 a day (PPP) as a poverty line (PPP). Narrowing the set of options to support the provision of global public goods by those countries, including its spillovers, as an outcome of a premature graduation must also be considered.
Regardless of where decision lines with respect to MIC effective graduation are to be drawn, one may presume that a country’s attainment of graduation conditions is a common desire for both client and non-client MDB shareholders. In the following items, we approach how the three-pronged set of graduation criteria – GNI per capita, access to external capital markets on reasonable terms and domestic institutions key for economic and social development – are intertwined in processes of successfully overcoming “middle-income traps”. Supporting MICs in such processes is an obvious agenda for MDBs.
- Middle-income traps [5]
The “middle-income trap” has become a broad designation trying to capture the many cases of developing countries that succeeded in evolving from low- to middle-levels of per capita income, but then appeared to stall, losing momentum along the route toward the higher income levels of advanced economies. Such a trap may well characterize the experience of most of Latin America since the 1980s, and in recent years middle-income countries elsewhere have expressed fears of following a similar path. Underlying these views is a more general feeling that moving up on the income ladder gets harder the higher one climbs.
This item outlines two different ways in which the concept has been approached since its first use 12 years ago by Gill and Kharas (2007). One has been empirical, where search is made to identify – or deny – breaks or turning points in time-series data exhibiting “growth traps” for middle-income economies. The other one, closer to the way it was originally suggested, refers to the need of policy and institutional change for a country to keep climbing the income ladder after a transition from low levels. Traps are seen as shortcomings resulting from the absence of any of those policy and institutional changes considered key to gearing up the transition from middle- to upper-income levels.
2.a The empirical approach: is there a middle-income trap?
Some authors have taken up the task of checking whether empirically one can detect, using either econometric techniques or some other criteria, features that can be considered as common – or frequent – among middle-income economies. More precisely, whether one may locate a “middle-income trap”.
One way to define the middle-income trap is in absolute terms, as a productivity and growth slowdown impeding hitherto fast-growing economies to graduate into the ranks of high-income countries. Since the 1950s, rapid growth has allowed a significant number of countries to reach middle-income status; yet, very few have made the additional leap needed to become high-income economies. Rather, many developing countries have become caught behind by a sharp deceleration in growth and in the pace of productivity increases.
Chart 5 depicts several countries as staying in a narrow income band along the period from 1960 to 2014. The question then becomes whether middle-income countries are more likely than others to experience a growth slowdown or whether they face a greater frequency of slowdowns than either advanced or low-income countries.
Chart 5
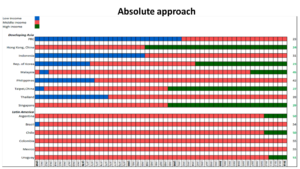
Source: ADB – Asian Development Bank (2017)
The middle-income trap can also be defined in relative terms, as a lack of convergence to some benchmark high-income country. Chart 6 displays the stagnation in relative terms of some Latin American countries (Mexico, Brazil, Ecuador and Guatemala), while Hong Kong, Spain, Ireland and Taiwan are some of the few economies that have managed to move up the scale toward high-income levels (Canuto, 2012). The question then becomes whether middle-income countries are more likely to experience a slowdown of their catching-up with upper-income countries than it is the case at lower stages of the income ladder.
Chart 6
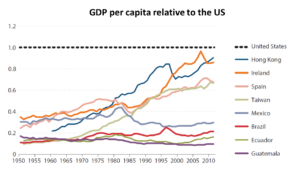
Source: Federal Reserve Bank of St. Louis (2016).
Overall, the evidence on the supposed middle-income trap is mixed. While Spence (2012), Eichengreen, Park, and Shin (2011, 2013) and Aiyar et al. (2013) find evidence that countries are more likely to slow down at middle income than at high or low income, others – e.g. Im and Rosenblatt (2015), Felipe et al. (2017) and Han and Wei (2017) – do not find growth patterns conforming to one clear pattern that can be characterized as a “trap.”
Bulman et al. (2014) distinguish between “escapees” and “non-escapees”. Escapees grow rapidly at all income levels (and all income ranges), whereas non-escapees tend to grow slowly at any development stage (not only within the middle-income range). Felipe et al. (2014) remark that the small number of former middle-income economies that became high-income economies relatively quickly were outliers from a historic perspective, whereas the rest of the middle-income economies have exhibited a weaker growth performance. They conclude:
“… we reject the existence of a middle-income trap as a generalized phenomenon. Instead, we argue that what distinguishes economies in their transition from middle to high income is the speed of these transitions, fast versus slow, a standard growth question.”
Such attempts to identify – or deny – turning points or any other empirical regularities across middle-income countries are inevitably riddled with challenges (Glawe & Wagner, 2016) (Agenor, 2016): thresholds – which often vary among studies – reflect some arbitrariness; results are data sensitive; [6] empirical definitions have no theoretical underpinning that may lead someone to expect the observed phenomena to be independent of space and time of observation; etc.
They also differ from the way Gill & Kharas (2007) approached the possibility – not as a matter of destiny – of middle-income traps as the result of lack of policy and institutional changes necessary to underpin the transition from middle- to upper-income levels, as policy and institutional requirements tend to be different from those of the evolution from low- to middle-income. As the authors remarked later, they referred to “complacency” risks, i.e. taking past successes as a guarantee of future ones, rather than updating policies and institutions (Gill & Kharas, 2015).
This approach leads to assessing economies as individual cases. Furthermore, Gill & Kharas (2007) also called attention to the need of theoretical developments on growth and productivity appropriate to inform policies in middle-income economies as such. There is a gap between, on the one hand, the classic “poverty trap” arguments used as references regarding the departure from low-income levels and, on the other, the Solow growth model where technological learning is absent and endogenous growth models mainly applicable to frontier advanced countries. Implications of being in the middle of the trajectory between low- and upper-income levels are also uncovered in North-South growth models (Krugman, 1985) (Ocampo, 1986).
In what follows, we summarize a possible narrative about policy and institutional changes expected to be faced by middle-income countries to climb up the income ladder.
2.b Middle income as a stage of growth and development
In most cases of successful evolution from low- to middle-income per capita in recent history, the underlying development process has been broadly similar. Typically, there is a large pool of unskilled labor that is transferred from subsistence-level occupations to more modern manufacturing or service activities that do not require much skill upgrade from those workers, but nonetheless employ higher levels of capital and embedded technology. The associated technology is available from richer countries and easy to adapt to local circumstances. The gross effect of such a transfer – usually happening in tandem with urbanization – is a substantial increase in “total factor productivity”, i.e. an expansion of the value of GDP that goes beyond what can be explained by the expansion of labor, capital and other physical factors of production to the economy.
Reaping the gains from such “low-hanging fruits” in terms of growth opportunities sooner or later faces limits, after which growth may slow down, and the economy may get trapped in middle-income levels. The turning point in this transition occurs either when the pool of transferrable unskilled labor is exhausted, or in some cases, when the expansion of labor-absorbing modern activities peaks before that exhaustion happens.
Beyond this point, raising total factor productivity and maintaining a fast growth pace becomes dependent on the economy’s domestic ability to move upward in manufacturing, service or agriculture value chains, toward activities characterized by technological sophistication, as well as high requirements in terms of human capital and intangible assets such as design and organizational capabilities. The path from low- to middle- and then to high-income per capita corresponds to increasing the shares of population moved from subsistence activities to simple modern tasks and then to sophisticated ones. Within-sector productivity gains and “moving up value chains” rise in weight relative to productivity-lifting cross-sector structural change (Gill & Kharas, 2015).
An institutional setting supportive of innovations and complex chains of market transactions is of the essence. Instead of mastering existing standardized technologies, the challenge becomes the local creation of domestic capabilities and institutions, which cannot be simply brought or copied from abroad. Provision of education to labor and of appropriate infrastructure becomes a minimum condition.
Current middle-income countries in Latin America decelerated their labor-transfer process from subsistence before exhausting labor surpluses, as macroeconomic mismanagement and inward orientation until the 1990s established early limits to that process. Nevertheless, some enclaves up on the ladder of value chains have been established (for instance, the technology-intensive agriculture, and sophisticated capabilities of deep-sea oil drilling and aircraft design in Brazil).
By contrast, Asian fast-growth economies have relied extensively on international trade to scale-up their labor transfer through insertion into the unskilled labor-intensive segments of global value chains. This has been facilitated by advances in information and communication technologies, combined with decreasing transport costs and lower international trade barriers. Taken together, these factors made possible the unbundling of production lines in chains of tasks with different degrees of sophistication requirements that can be geographically dispersed (Canuto, 2017; 2018a).
Chart 7 shows the structure of wealth for economies by income group and they illustrate the path of evolution that a country is expected to cross on the way up the ladder. It displays averages and individual countries will differ, e.g., because of different levels of natural wealth (Canuto & Cavallari, 2012). However, three broad features may be highlighted: the high and increasing weight of human capital (World Bank, 2018a); the weight of produced capital – physical capital – stabilizes in relative terms after the ascent from low-income levels; and, regardless of country-specific natural resource richness, its weight decreases relatively along the ascent.
Natural resource-rich middle-income countries face a road of their own. Unlike manufacturing, natural resource use is to a large extent idiosyncratic, in the sense that each concrete experience is unique. That creates a privileged scope for local creation of capabilities in sophisticated upstream and downstream activities, with the corresponding challenge to do so in a sustainable fashion. Nevertheless, an institutional setting supportive of innovations and complex chains of market transactions, high-level education and local building of intangible assets are also preconditions.
Although not included in the data displayed in Chart 7, one may expect a strong correlation between the human capital accumulation and local development of intangible assets (capabilities to adapt technologies and innovate; managerial and organizational capabilities; rules and institutions that do not impose costs and waste on chains of transactions which tend to become dense and complex as the economy climbs the ladder). One may expect the return from these assets to underlie what Moses Abramovitz called our “measured ignorance” – namely, total factor productivity increases not explained by the accumulation of production factors in exercises of production function-based GDP and productivity decomposition.
Chart 7
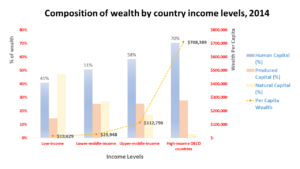
Source: World Bank (2018b).
Local development of capabilities of imitation and creative adaptation of existing technologies, followed by or in tandem with capabilities to innovate, is a requisite to raise productivity, upgrade occupation and move up the income ladder. Any application of technology needs locally specific content that cannot be acquired or transferred by means of textbooks or other codifiable forms of knowledge transmission. This knowledge cannot be made explicit, simply transmissible in blueprints, and thus cannot be perfectly diffused as either public information or private property. It must be developed locally. Production, technology adoption, and invention requires a relatively high level of such idiosyncratic knowledge and local capabilities (Canuto, 1995).
While technology originators tend to follow a sequence reverse to latecomers, it is typical for the latter to start from production and technological adoption and only then move on to invention. That has been the case in South Korea and China (Canuto, 2018b). These countries have developed innovation capabilities after intense learning through using and adapting existing technologies.
Simple interconnectedness does not automatically spark productivity increases and local innovation. Success depends on the presence of a broad set of complementary factors: access to finance, infrastructure, skilled labor, and good managerial and organizational practices. In the absence of these factors, returns from investing in the development of capabilities are likely to be low (Canuto, Dutz & Reis, 2010) (Cirera & Maloney, 2017).
Solutions must be found to market failures that generate disincentives to the accumulation of knowledge, but the private and public sector interaction cannot be unfriendly to the rising density and complexity of chains of transactions accompanying progression. Transaction costs associated with “doing business” – such as trading across borders, hiring and enforcing contracts – cannot be too high, whereas other dimensions of the “investment climate” – like policy uncertainty, macroeconomic instability, corruption, losses due to crime, infrastructure and others (Canuto, 2007) – must be favorable so as to not disincentivize investment in the acquisition of capabilities. In a broad sense, the structure of incentives for economic agents must be such as to favor the search for efficiency rather than seeking “rents” (Canuto & Ribeiro dos Santos, 2018).
International trade and technology transfer have proven to be important boosters to such a journey, but institutional change, high-level education and local building of intangible assets are also essential for sustaining this over the long run. South Korea is a prime example of a country that exploited these opportunities to move all the way up the ladder.
It is worth remarking that, particularly in the case of large economies, heterogeneity and diversity of states is to be expected. Brazil’s per-capita income, classified as upper-middle by the World Bank, is associated with an economic structure where one locates both high- and low-income types of activities and jobs. Overcoming middle-income traps in such a case means upgrading a substantial share of overall employment, including by rescuing low-income agents left behind as such by the previous transition (Canuto, 2011).
Traps may take place in situations when upgrading faces high obstacles to gain competitiveness because of incumbents in global markets. Gill & Kharas (2007) used “middle income trap” to designate economies that were being “squeezed between the low-wage poor country competitors that dominate in mature industries and the rich-country innovators that dominate in industries undergoing rapid technological change”. To a large extent, manufacturing in Latin America was relatively squeezed by the large addition of cheaper labor to the global economy resulting from the downfall of the Soviet Union and China’s economic integration.
Ultimately, however, one may point to local insufficiency or appropriateness of some of the policies and institutions necessary to underpin the transition upward as potential causes of middle-income traps. Agenor & Canuto (2015; 2017) developed analytical models of multiple equilibria in which distorted incentives and misallocation of talent, weak contract enforcement and protection of intellectual property rights, lack of access to advanced infrastructure, and lack of access to finance create the possibility of a middle-income economy to settle on a “bad” low-growth path. In turn, Aiyar et al. (2013) and Han & Wei (2017) approach the negative implications for growth of a high frequency of macroeconomic booms-and-busts.
- Policies and institutions needed to climb up the income ladder and graduate
As an economy moves beyond the track from low- to middle-income stages, the set of policy priorities changes (ADB, 2017):
- Accumulate human capital and develop high cognitive skills
As economies evolve from low- to middle-income status, so do their growth drivers. While accumulating physical capital remains important for growth in middle-income economies, human capital accumulation and total factor productivity improvement – or growth in production not derived from higher use of inputs – acquire larger weights in growth determination. Productivity-centered growth is needed to reach high income.
Human capital accumulation supports both growth and equity and the emphasis must be on ramping up the quality of education. Economies with relatively high cognitive skills benefit from having a critical mass of students likely to become innovators. As economies move closer to the technological frontier, the returns on research-oriented innovation pick up tangibly.
World Bank (2017a) recognizes the difficult pass from the recognition of the importance of education for development to the establishment of effective policies which increase human capital in the population. But it also provides directions for successful policies, and we underscore two of the most promising areas.
Teaching to the level of the student is a crucial recommendation. If a student is not following lessons, they may become completely demotivated and give up on schooling altogether. Effective policies need not involve the personalization of teaching for every student, which would imply daunting costs. They can be as simple as reassigning students to classes based on their current level of understanding of the material, instead of the blunt age criteria currently implemented in most countries. According to the Chief Economist for the United Kingdom’s foreign aid agency, Rachel Glennerster, such policies could deliver the equivalent of 460 learning-adjusted school years (LAYs) for as little as US$130. Other promising areas for teaching to the level of the student include remedial support and computer-assisted learning. The latter, however, needs to be implemented as an auxiliary tool for teachers, instead of replacing them.
Investing in early year education is another policy identified by the World Development Report 2018 which has a large body of evidence to support it. The economist James Heckman and others have produced several studies documenting how crucial it is to properly stimulate children from an early age so that they can develop not only cognitive but also noncognitive skills. While many countries only offer public schooling from age six until high school (and many of them spend vast resources in university education), the greatest returns for human capital formation are, by far, concentrated in early childhood (Chart 8):
Chart 8 – Investments in high-quality programs during children’s early years pay off
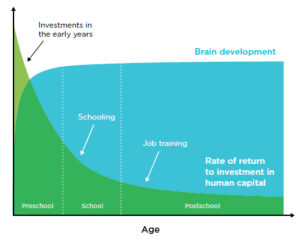
Source: World Bank (2017a).
A role of MDBs may lie in helping countries adopt those policies themselves. Education is one of the highest government expenditures, and they are increasing. The World Bank estimates that governments spent on average 4.8% of GDP in education in 2015, which amounts to around US$3.5 trillion, orders of magnitude higher than MDBs financial capacities. Their greatest impact, therefore, will be related to properly informing the debates around the world, providing evidence which will not be directly linked to any of the main groups of interest, and designing programs, such as Development Policy Loans (DPLs), which may provide the incentives for the transition towards more effective policies.
- Foster entrepreneurship
Innovation matters more as economies approach the technological frontier and entrepreneurship turns new ideas or technology into innovation-based growth. Opportunity-driven entrepreneurship, which is often built on new ideas or technology, increasingly outweighs necessity-driven entrepreneurship, which responds to existing market needs.
Risk-taking entrepreneurs take the lead in fostering innovation, and these individuals respond to incentives that are either strengthened or weakened by economic policies and institutions. Governments can promote innovative entrepreneurship through stronger intellectual property protection and rule of law, better access to finance, and effective competition policies.
The main takeaway for fostering entrepreneurship is that countries should strive to create the conditions by which private actors are able to implement their visions, instead of trying to evaluate ex ante which proposals have a greater chance of success. In that vein, improving the business environment is an essential task. World Bank (2017b) provides some of the most important measures that can be taken: business entry reforms, making it easier for people to start their own businesses; business licensing and inspections reform, making sure that licensing is not used as a source of revenue which increases the cost of business; construction permitting reform, which can both decrease the costs for formal businesses to be physically established or to expand, but also avoid unsafe construction in the informal sector; and quality infrastructure and standards reforms. The general theme above is one of decreasing rent-seeking from the part of governments. This means that the particular aspects of governance reforms should also be addressed, especially in order to raise rewards of efficiency-seeking behavior relative to rent seeking – Canuto and Ribeiro dos Santos (2018).
A crucial role for MDBs is one they already fulfill but could expand on: documenting in the most objective way possible the current state of the business environment over the world. This not only helps empower administrations which pursue improving business environments for their own sake, but also creates incentives for politicians which are merely expecting to remain on the job to take measures which may improve the situation of their country.
- Increase complexity
Graduation to high income requires a diverse and sophisticated product mix. In addition to producing a wider range of goods, middle-income economies must aim to produce more complex goods and services, which support higher productivity and better wages.
Rising TFP levels reflect the accumulation and development of domestic capabilities of production, organization, and management. These capabilities, in turn, keep a feedback loop of learning relationships with the complexity of production processes. This is illustrated in the correlation depicted in Chart 9 between GDP per capita and the Economic Complexity Index -see the MIT’s Observatory of Economic Complexity and Harvard’s Atlas of Economic Complexity.
Chart 9
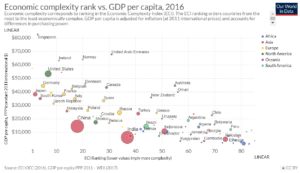
Source: Ortiz-Ospina and Beltekian (2018).
While this diagnosis is well-established, there is much less agreement over what governments should do to increase complexity in such a way that reliably advances along a sustained growth and development path. The most obvious remedy would be direct industrial policies to stimulate sectors which embed that complexity, such as high-technology industries and services. But properly conducting industrial policies is a very hard task which is often subject to capture by beneficiaries, leading overtime to rent appropriation outweighing gains in complexity and development of capabilities – an issue that even proponents of these measures recognize (Warwick, 2013). On the other hand, one may be sure that accumulation of human capital and cognitive skills, as well as microeconomic incentives rewarding learning efforts are requisites for any deepening of complexity and local development of capabilities.
- Provide access to advanced infrastructure
Investments in infrastructure are a component of the produced capital accumulated as a country climbs up the income ladder, as depicted in Chart 7. However, infrastructure needs shift as an economy becomes more complex and sophisticated at upper income levels. There is a nexus of advanced infrastructure, highly developed skills, and innovation. Fine-tuning infrastructure regulation and the labor division between public and private sectors in the provision of services and investment finance must be made in order to lift investments in corresponding sectors.
It should be noted that the world economy – and emerging market and developing economies in particular – have displayed a gap between infrastructure needs and its finance along recent decades. On the one hand, infrastructure investment has fallen far short of what would be necessary to support potential growth. On the other, abundant financial resources in world markets have been facing very low and decreasing interest rates, whereas opportunities of higher return from potential infrastructure assets are missed.
A better match between private sector finance and infrastructure can be obtained if properly structured projects are developed, with risks and returns distributed in accordance with different incentives of stakeholders (Canuto and Liaplina, 2017). Investments may also be maximized if financial operations by public-sector entities – and MDBs – are designed so as to crowd-in – rather than crowd-out – private participation, like in the World Bank’s approach of “maximizing finance for development” (Development Committee, 2017).
- Pursue macroeconomic stability
An environment conducive to growth needs macroeconomic stability. When a country reaches middle income, its growth rate tends to become more vulnerable to indicators affecting macroeconomic stability—such as whether the country faces a banking or currency crisis, the extent of capital inflows other than foreign investment, and government debt as a share of GDP. Climbing up the income ladder becomes harder to obtain with a high frequency of booms and busts, as it runs against higher-risk, long-term investment decisions.
Even though the major responsibility for pursuing macroeconomic stability lies inevitably with country policy makers, the Bretton Woods model established in the 1940s assigned a responsibility of supporting it to the IMF (Canuto, 2019a). There are still some products by MDBs and other multilateral financial institutions that can help achieve that objective – like Public Expenditure Reviews (PERs), Financial Sector Assessment Programs (FSAP) etc. – by shedding light on challenges to be faced by authorities themselves.
In short, the role of the government necessarily evolves as an economy progresses, becoming more of a supportive type as the private sector fully fledges. The government must shape an environment conducive to innovative entrepreneurship by promoting investment in education and infrastructure, as well as macroeconomic stability.
- Concluding remarks
The qualitatively distinctive nature of the middle-income stage of development differentiates it from both high- and low-income phases, demanding an effort to go beyond generalizations about growth and productivity. In our view, the relevance of the concept of middle-income traps stems not from being a hypothesis about deterministic trends in growth, but rather as a warning shot about “complacency” risks of casting forward past transition successes. Instead, updating and prioritizing policies and strengthening institutions to new requirements are paramount. Individual middle-income country experiences of falling into a “trap” could also be approached as cases of lack of – or failing performance in – footing the bill in terms of appropriate foundations for development.
Human capital accumulation, development of high cognitive skills, fostering entrepreneurship, advanced infrastructure availability, macroeconomic stability, and deepening of complexity in production all relate to “domestic institutions key for economic and social development”. Macro-financial stability is, in turn, a precondition to “access to external capital markets on reasonable terms.” As they are all policy priorities for an economy to move beyond the track from low- to middle-income stages and reach high-income levels, one may notice a convergence between overcoming growth traps and crossing the way to MIC graduation in MDBs.
References
ADB – Asian Development Bank (2017). Asian Development Outlook 2017 – Transcending the Middle-Income Challenge, Manilla.
Agenor, P-R. (2016). Caught in the Middle? The Economics of Middle-Income Traps, FERDI Working Paper 142, revised version, May.
Agenor, P-R. and Canuto, O. (2015). Middle-income growth traps, Research in Economics, Volume 69, issue 4, December, p. 641–660.
Agenor, P-R. and Canuto, O. (2017). Access to finance, product innovation and middle-income traps, Research in Economics, Volume 71, Issue 2, June, p. 337-355.
Aiyar, S.; Duval, R., Puy, D.; Wu, Y. and Zhang, L. (2013). Growth Slowdowns and the Middle-Income Trap, IMF Working Paper. No. 13/71. Washington, DC
Bulman, D., Eden, M. and Nguyen, H. (2014). Transitioning from Low-Income Growth to High- Income Growth. Is There a Middle-Income Trap?, Policy Research Working Paper No. 7104, World Bank, Washington DC.
Canuto, O. (1995). Competition and endogenous technological change: an evolutionary model, Revista Brasileira de Economia, volume 49 (I), Jan.-Mar., p. 21-33.
Canuto, O. (2007). Investment climate and microeconomic reforms, Roubini’s EconoMonitor.
Canuto, O. (2011). Navigating the road to riches, Project Syndicate, July 12.
Canuto, O. (2017). Overlapping globalizations, Policy Center for the New South, November, PB 17-42.
Canuto, O. (2018a). Can services replace manufacturing as an engine for development? Capital Finance International, summer issue.
Canuto, O. (2018b). Making Returns on Knowledge – How Innovation Can Flow from Globalisation, Capital Finance International, autumn issue.
Canuto, O. (2019a). New Challenges Faced by the Bretton Woods Institutions, Center for Macroeconomics and Development, April.
Canuto, O. (2019b). World Bank: A Hummingbird on the Firing Line, Policy Center for the New South, January.
Canuto, O. (2019c). Traps on the road to high income, Policy Center for the New South, Policy Brief PB-19/14, April.
Canuto, O., Dutz, M. and Reis, J.G. (2010). Technological Learning and Innovation: Climbing a Tall Ladder in The Day after Tomorrow: A Handbook on the Future of Economic Policy in the Developing World, ed. by Canuto, O. and Giugale, M., World Bank. Washington, DC.
Canuto, O. and Cavallari, M. (2012). Natural Wealth: Is It a Blessing or a Curse?, Economic Premise n.83, World Bank, Washington, DC.
Canuto, O. and Ribeiro dos Santos, T. (2018). It’s evolution, baby – how institutions can improve without critical junctures, Policy Center for the New South, November, PB 18-39.
Cirera, X. and Maloney, W.F. (2017). The innovation paradox: developing-country capabilities and the unrealized promise of technological catch-up, World Bank, Washington, D.C
Development Committee (2017). Maximizing Finance for Development: Leveraging the Private Sector for Growth and Sustainable Development, September 19.
Development Committee (2018). Sustainable Financing for Sustainable Development: World Bank Group Capital Package Proposal, April 21.
Eichengreen, B., Park, D. and Shin, K. (2011). When Fast Growing Economies Slow Down: International Evidence and Implications for China, NBER Working Paper 16919, March.
Eichengreen, B., Park, D. and Shin, K. (2013). Growth Slowdowns Redux: New Evidence on the Middle-Income Trap, NBER Working Paper. No. 18673.
Federal Reserve Bank of St. Louis (2016). Relative income traps, Economic Research Review, March.
Felipe, J., Kumar, U. and Galope, R.. (2017). Middle-income transitions: trap or myth?, Journal of the Asia Pacific Economy, 22:3, 429-453,
Gill, I. and Kharas, H. (2007). An East Asian Renaissance: Ideas for Economic Growth, World Bank, Washington, DC
Gill, I. S. and Kharas, H. (2015). The Middle-Income Trap Turns Ten, Policy Research Working Paper 7403. World Bank, Washington, DC.
Glawe, L. and Wagner, H. (2016). The Middle-Income Trap: Definitions, Theories and Countries Concerned—A Literature Survey, Comparative Economic Studies, December, Volume 58, Issue 4, p. 507–538.
Han, X. and Wei, S-J. (2017). Re-examining the middle-income trap hypothesis (MITH): What to reject and what to revive?, Journal of International Money and Finance, Volume 73, Part A, May, p. 41-61.
Im, F. G. and Rosenblatt, D. (2013). Middle-Income Traps: A Conceptual and Empirical Survey, Policy Research Working Paper No. 6594. The World Bank. Washington, DC.
Knack, S., Rogers, F. & Heckelman, J. (2012). “Crossing the threshold: A positive analysis of IBRD graduation policy”, The Review of International Organizations, Springer, vol. 7(2), pages 145-176, June.
Krugman, P. (1985). A ‘Technology Gap’ Model of International Trade, in Structural Adjustment in Developed Open Economies, ed. by Karl Jungenfelt and Douglas Hague, International Economics Association.
Meltzer, A. (2000). The report of the International Financial Institution Advisory Commission: comments on the critics; reform of the international architecture.
Ocampo, J.A. (1986). New developments in trade theory and LDCs, Journal of Development Economics, Volume 22, Issue 1, June, p. 129-170.
Ortiz-Ospina, E. and Beltekian, D. (2018). How and why should we study ‘economic complexity’? Our World in Data, March 19.
Spence, M. (2012). The next convergence. The future of economic growth in a multispeed world. New York, NY: Farrar, Straus and Giroux.
Warwick, K. (2013). Beyond Industrial Policy: Emerging Issues and New Trends, OECD Science, Technology and Industry Policy Papers, No. 2, OECD Publishing, Paris.
World Bank (1944). International Bank for Reconstruction and Development – articles of agreement.
World Bank (2011). Latin American and the Caribbean’s long-term growth: made in China?, Washington, DC.
World Bank. (2016). Review of IDA’s graduation policy. IDA18, Washington, D.C
World Bank (2017a). World Development Report 2018 – LEARNING to Realize Education’s Promise, Washington, DC.
World Bank (2017b). Business environment.
World Bank (2018a). World Development Report 2019 – The changing nature of work, Washington, DC.
World Bank (2018b). The Changing Wealth of Nations 2018: Building a Sustainable Future, Washington, DC.
[1] Respectively, senior fellow at the Policy Center of the New South and non-resident fellow at the Brookings Institution, and senior advisor and advisor at the Board of Executive Directors of the World Bank Group. Opinions here are their own.
[2] The relative weight of the preferred creditor status and the significant amount of callable capital in explaining the low-cost funding of most MDBs is an unsettled issue. If the “preferred creditor status” matters most, implicit subsidies in their operations correspond to a partial transfer of risks to other foreign liabilities of the country, whereas the role played by callable capital corresponds to implicit guarantees provided also by non-client shareholders, especially those with high credit ratings.
[3] Graduated Countries: Iraq, Venezuela, Gabon, Trinidad and Tobago, Oman, Portugal, The Bahamas, Cyprus, Barbados, Republic of Korea, Slovenia, Czech Rep., Estonia, Lithuania, Hungary, Latvia and Slovak Rep.
[4] Interestingly, it is worth noting that countries considered to be still fighting “middle-income traps” – as approached below – have remained well below that median income.
[5] On this item, see Canuto (2019c).
[6] Eichengreen et al (2011) and (2013) used different sets of Penn World Tables and reached different results.