Policy Center for the New South, Policy Paper PP-03/24
Eduardo Andrade and Otaviano Canuto
Population aging is a strong trend in place. Some negative consequences of aging are on the horizon: greater fiscal imbalances and the risk of economic stagnation. Most high-income countries will experience a decline in their populations over the next few decades, and immigration is a way to offset this tendency. On the source side of immigration flows, ‘brain drain’ is a risk.
In this policy paper, we start by summarizing some general features of migration flows and then we delineate how the demographic transition will unfold differently across countries and continents. We then discuss the two primary costs of aging to high-income countries, and their potential influence on immigration policy. We also present the case of Japan, a nation that has grappled with the consequences of a declining and aging population for several years, serving as a template for other countries destined to confront similar circumstances in the forthcoming decades. Finally, we offer our conclusions.
- MIGRATION FLOWS AND DEMOGRAPHIC DYNAMICS
The percentage of people immigrating and residing in another country has consistently been low, accounting for 2.3% (84.5 million people) and 3.6% (280.5 million people) of the global population in 1970 and 2020, respectively. In essence, individuals typically live and die in their countries of birth.
As expected, most immigrants are found in high-income countries (65% of the total, or 181.9 million people). However, these individuals may originate from either lower-income countries or other high-income nations.
For instance, the United States stands out as the primary destination for immigrants (50.6 million people, or 18% of the total). Sixty-two countries contribute 82.8% of immigrants to the U.S., with 19 of them classified as high-income countries (comprising close to 18% of the total immigrants from these 62 countries to the U.S.).
Those who emigrate generally do so for economic reasons, seeking better job opportunities and increased income. Approximately three-quarters of them migrate to higher-income countries, compared to their countries of origin, whether developed or not.
There is discernible selectivity in the immigration process when examining the profile of immigrants. The majority fall within the working-age range (78%), spanning from 15 to 64 years old. They tend to possess higher educational qualifications than their non-migrating counterparts, resulting in a higher income-earning capacity. Simultaneously, they appear to be healthier and more productive than residents of the host countries holding similar qualifications[1]. For instance, Table 1 shows that the U.S. immigrant population has higher average levels of education than the native-born population.
Table 1. United States: Structure of Population Aged 25 and Over by Origin and Level of Education (as %, 2021)
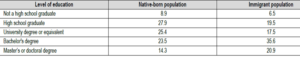
Source: Artus (2023).
The limited labor mobility between developed and developing nations, coupled with selectivity in immigration, reflects the barriers imposed by developed countries through their immigration policies. These barriers, alongside transportation costs, can only be surmounted by individuals with certain income levels, those possessing skills adaptable or beneficial to the new country, or those willing to take significant risks, even risking their lives, through attempts at illegal immigration.
In essence, there exists latent immigration supply—individuals desiring to leave less developed or impoverished countries for wealthier destinations. The magnitude of this supply depends on various factors: population size, income levels in non-developed countries, income disparities between rich and poor nations, and the costs associated with such migration, including transportation expenses.
However, the pivotal factor determining whether this flow will transpire lies in the demand, specifically how restrictive the immigration policies of high-income countries are. Policymakers weigh the costs and benefits of expanding immigrant inflows.
Two opposite factors are at play. On one hand, locals may fear that excessive influxes of immigrants will diminish job opportunities and wages, suspecting that the costs of providing public services, such as healthcare, for new inhabitants will fall on them. There may also be concerns about the increasing heterogeneity of society in terms of religion, ethnicity, or income. All these factors drive policymakers to restrict immigration.
On the other hand, government tax revenues stands to increase with immigrants participating in the labor market. Qualified young people from other countries can serve as innovators and entrepreneurs, propelling economic growth. New workers may undertake tasks rejected by locals or for which there is no available workforce. These factors encourage policymakers to advocate for increased immigration flows.
The ongoing demographic transformation, which is set to continue throughout this century, has the potential to reshape the factors conducive to increased immigration flows into high-income countries.
In 48 years, the world population doubled, reaching eight billion people in 2022. This rapid growth resulted from a combination of two factors: high fertility rates (FR, the number of children per woman) and technological development that reduced mortality rates across all age groups, leading to increased life expectancy and a higher number of live births.
Projections, however, suggest that this unchecked growth will not continue. The peak is expected to be around 10.5 billion inhabitants, likely in the early 2090s, followed by a decline, reaching 10.35 billion people by 2100[2].
In 2021, 33 countries were already experiencing population declines, including Italy and Japan. Projections indicate that by 2100, 94 countries, including Brazil, India, and Morocco, will witness shrinking populations. However, not all nations will share this trend. For instance, 55 countries, primarily in Africa and Asia, are expected to sustain population growth[3].
Of the current high-income countries according to the World Bank classification, nearly 70% are projected to see population declines in the future. Others will only potentially avoid this fate through immigration.
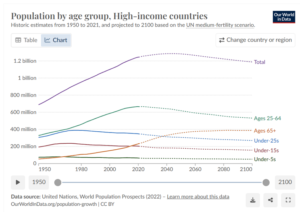
An inevitable trend among the group of high-income countries is the aging of their populations. Figure 1 shows population projections for different age groups in high-income countries up to 2100. It indicates that the population is already decreasing for all age groups up to 64 years old. In particular, the peak for the age group between 25-64 years was in 2023. This occurs even when taking into account the expected flow of immigrants in the coming decades, assuming no major change in the weights of push-and-pull factors behind migration. Only the population of the elderly, aged 64 and above, is projected to continue growing until almost the end of the century. In particular, the U.S. Census projects the peak of the 30-50 age group (the most productive age bracket) will occur in 2045.
Figure 1
These anticipated demographic transformations will impose two primary costs on these high-income countries. They may fall into a “gerontocratic fiscal trap”[4] and experience economic stagnation. One way to mitigate these adverse outcomes is to ease barriers in their immigration policies.
- FROM PEAK TO DECLINE OF WORLD POPULATION: A LOOK AT TWENTY-FIRST CENTURY CHANGES
Trends in the world population, without continuous reductions in mortality, reflect the movements of the fertility rate (FR). Currently, the rate is decreasing. Until 1965, women had on average more than five children, but now this number is less than 2.5.
Several factors explain the decline in FR. There is increased demand in the job market for qualified professionals, prompting parents to invest more resources in enhancing their children’s human capital. Rather than having many children, families opt to have fewer and invest more in each child to ensure success in the professional world. Additionally, the costs of education are high and rising.
Women, when provided with opportunities, gain more years of education, actively participate in the labor market, and become financially independent. With less unequal relationships with their spouses, they gain veto power in deciding how many children the couple will have. Higher education increases the opportunity cost of staying out of the job market, leading women to decide to have fewer (or no) children, especially without significant contributions from men in domestic tasks (Agenor and Canuto, 2015).
Several other factors contribute to the decline in the FR, including the process of urbanization—it is more challenging to raise children in cities compared to rural areas—and access to birth-control methods (condoms, pills, IUD, etc.).
Because of their varying stages of economic development, countries differ in key factors influencing the FR, including the labor market’s demand for human capital, the process of urbanization, and female empowerment. As a result, the timing of population reversal does not unfold uniformly across all nations. Additionally, as mentioned before, some countries are expected to experience population growth throughout this century.
Based on the current FR, countries can be classified into three groups (see Table A1 in the appendix for the list of countries in each group).
2.1 Group 1: Population Growth
Countries in this group have an FR (in 2021) greater than 2.9. Projections suggest that the populations of all these countries will continue to grow until the end of this century[5]. This group comprises 52 countries, located in Africa (41), Asia (10), and Oceania (Papua New Guinea).
In the World Bank classification, these countries are considered low or lower-middle-income economies, with GDP per capita of up to $4,465. The exceptions are six countries with upper-middle-income status (Equatorial Guinea, Iraq, Palestine, Gabon, Namibia, Kazakhstan) and one high-income country (Israel). The latter has a high FR (2.98) compared to its developed peers (which is generally less than 2.1) for religious and security reasons.
Because of their generally lower economic status, Group 1 countries do not offer attractive economic opportunities to attract immigrants. The exceptions, with a share of their population coming from other countries exceeding 10%, are two upper-middle-income countries—Gabon (15.56%), Kazakhstan (20.12%)—and the only high-income country in the group: Israel (24.95%).
With the evolution of key variables affecting the FR, a gradual decline is expected over the next few decades. However, this will not prevent the size of their populations from continuing to grow. Because Group 1 countries are economically backward, mortality rates in different age groups are relatively high and have room for improvement in the coming decades. Improvements in nutrition, access to health, and the adoption of advanced medical techniques developed in developed countries are expected to contribute to increases in life expectancy.
In summary, until the end of this century, countries in Group 1 will be marked by high birth rates and extended citizen lifespans, resulting in continuous population growth.
2.2 Group 2: Population Decline
This group consists of countries with an FR below 2.9 (in 2021), with populations already declining, such as Italy and Japan, or expected to decline at some point during this century, such as Brazil, India, and Morocco. There are 94 countries in this group in total.
Members of this group have varying characteristics and are located on all continents, spanning all income groups defined by the World Bank. Of the 94 countries, 71% (or 64) already have an FR below 2.1 children per woman. Once below this threshold, there is no record of any country systematically reversing it.
The expectation is that the same trend will occur with other countries in this group. Families will continue to trade quantity for the quality of children’s life conditions. Factors including better education for women, reduced gender inequality, and urbanization will contribute to this decline. At some point, the FR will be less than 2.1, will continue to decline, and will not recover.
High-income countries in this group attract immigrants because of their attractive economic opportunities. However, some of them have very restrictive immigration policies and receive practically no foreigners, such as South Korea and Japan. Others have histories of significant influxes of immigrants, with shares of the population coming from other countries exceeding 10% (in 2015). Examples include Germany (14.88%), France (12.09%), and New Zealand (22.96%). With low fertility rates, the eventual future flow of immigrants will not be sufficient to prevent a decline in population size.
Mortality rates in countries in this group are likely to continue to decline. This movement should be more intense in economically backward countries, which will eventually have access to technologies already available in the field of medicine, resulting in increases in life expectancy. In high-income countries, responsible for expanding the boundaries of knowledge, declines in mortality rates should be slower.
For those countries that already experience declines in their populations, fertility rates are already lower than mortality rates. For others, at some point during this century, the same will happen.
In summary, until the end of this century, for all countries in Group 2, births will not be enough to compensate for deaths. Additionally, the flow of immigrants, into those capable of attracting them, will not be enough to prevent the eventual declines in their populations, unless they radically change their immigration policies (see next section).
2.3 Group 3: Population Growth Despite Low Fertility
Countries in Group 3 have FRs below 2.7 (in 2021). Of the 14 countries in this group, 12 have in fact an FR below 1.9, below the replacement rate of 2.1. The other two countries in the group are Oman (FR=2.62) and Kuwait (FR=2.11).
The contrast with the previous group is that projections suggest the size of their populations will continue to rise until the end of this century[6]. These countries have traditions of receiving immigrants, and immigrant flows tend to be enough to compensate for the decline in FR and prevent population declines. All currently have a share of their population composed of foreigners exceeding 10%, except for Czechia (3.84%).
Contributing to their attraction for migrants is the fact that all countries in the group are high income, as characterized by the World Bank. That is, they have per-capita incomes above $13,845. As an example of how immigration can have an impact on a country’s population growth rate, the rate in the United States in 2019 (before the COVID-19 pandemic; see below) was twice as high when immigrants are counted (0.64% vs. 0.29%).
It is important to mention that it is not expected that the FR of Group 3 countries will rise again and surpass 2.1 for those that have already dropped below that level. Nor is it necessarily expected that FR will exceed 2.1 for the others. In fact, the expectation is that, like members of Groups 1 and 2, the process of declining FR will continue for Group 3 countries. This is because the variables that influence FR behavior—such as women’s education levels, the importance of human capital in the economy, and female empowerment—are expected to move in a direction that affects it negatively. Therefore, there is no expectation that population growth over the next few decades will rely on the contribution from this factor.
As is happening in almost all countries, with the United States recently being an outlier in this process, the trajectory of increasing life expectancy is expected to continue for all members of Group 3. New scientific discoveries will continue to extend people’s years of life. Since Group 3 countries already have high life expectancies, additional gains in this regard are slower.
In summary, until the end of this century, for all countries in Group 3, births will not be enough to compensate for deaths. Despite this, and because they are countries with the power to attract immigrants, their populations may continue to grow for some time.
2.4 Different population growth trajectories
As a result of the combined effects of demographic change on different groups of countries, projections suggest significant changes in the trajectory of population growth for continents. Figure 2 shows how FRs vary among regions and major countries.
Figure 2
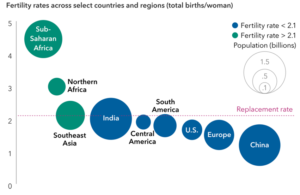
Source: Franz (2024), based on United Nations (U.N.) Population Division.
Note: Fertility rates reflect latest estimates for 2023, published July 2022.
Currently, Europe is recording a reduction in the number of inhabitants, with this process having started in 2021. The trend is not expected to be reversed. However, by the end of this century, the same will happen with South America, Asia, and North America. Their respective populations are expected to start to decline in 2056, 2059, and 2074, respectively. Oceania tends to not have the same fate because it may rely on the influx of immigrants.
Africa will be the only continent where the population will continue to grow until the end of this century, even without immigration flows. This is a result of the late arrival of the economic development process in the region, from the importance of human capital, urbanization, the arrival and spread of medical discoveries, to female empowerment. The combination of an FR below 2.1 and reductions in mortality rates to levels closer to developed countries in different age groups will be experienced last in Africa.
Leaders of nations are not passive observers of the declining trajectories of their populations. Many have declared increasing fertility as a primary policy objective. In the 1970s, only 15 nations did so; however, in the United Nations survey of 2019, this number had risen to 55.
Various policies have been implemented to boost the FR by offsetting the financial burden of parenthood (although some countries have policies that would tend to be a disincentive for larger families, such as the benefit cap in the UK for families with more than 2 children). These initiatives include the distribution of ‘baby bonuses’ (observed in Australia and Spain), incentives for families with two or more children (for example, Russia), monthly financial support of $770 during a child’s first year of life (Korea), reimbursement of hospital expenses coupled with maternity leave, and the potential expansion of health insurance coverage to include fertility treatments (as practiced in China). Additionally, policies such as counting a year of social security contribution for each child (Argentina), maternity leave, and the availability of childcare in various countries have been implemented[7]. Figure 3 illustrates the limited impact of policy responses to low fertility in the cases of Korea and Singapore:
Figure 3. Korea, Singapore: Policy Responses to Low Fertility
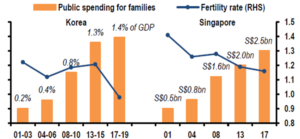
Source: JPMorgan, Global Economic Research, 09 March 2024.
In general, these measures have had limited ipact. Couples, incentivized by government financial support, often accelerated their plans for parenthood. This temporary surge in fertility rates was typically followed by a decline, returning to pre-incentive levels. Moreover, no country has managed to restore its FR to 2.1, once it has fallen below this threshold.
The lesson is that achieving success with policies aimed at increasing fertility, and consequently utilizing this approach to change a country’s population trend, is a challenging endeavor.
- COSTS OF RESTRICTING IMMIGRATION IN DEVELOPED COUNTRIES
The demographic transformations projected for this century, as discussed in the preceding section, have the potential to heighten the costs for developed countries of restricting immigration. We now address two significant costs: fiscal and growth-related.
3.1 ‘Gerontocratic Trap’
The population dynamics discussed above will increase the so-called ‘dependency ratio’ in different countries, meaning the number of elderly individuals plus children as a share of the number of people of working age. For developed countries, this ratio is expected to shift from 54.46% in 2022 to 84.4% in 2100[8].
Working age populations, through taxes, typically finance health and retirement expenditures. With a diminishing number of young contributors, the revenue base is at risk, while the demand for expenses will surge with an increasing elderly population.
Advanced countries are already grappling with substantial fiscal imbalances, and the trajectory suggests further deterioration. According to the IMF (2023), the net debt level of advanced countries is projected to increase from 74.9% in 2014 to 87.6% in 2028. Five of these countries will reach levels exceeding 100% in 2028: Japan (153.2%), Italy (130.6%), USA (111.6%), Belgium (104.8%), and France (100.4%).
One might argue that these fiscal imbalances could be rectified by curbing expenditures, such as raising the retirement age and reducing social contributions. However, the median voter´s age is set to rise, giving greater political influence to older individuals who will likely advocate for more, not less, expenditure, thereby intensifying the strain on government budgets.
The peril is that developed nations might fall into a “gerontocratic fiscal trap.” To avert fiscal imbalances, policymakers will be compelled to increase taxes on the younger population. Consequently, younger individuals will have less disposable income, potentially making them less inclined to embrace parenthood. This lower fertility rate could result in a diminished future revenue base with fewer young contributors in the active population, exacerbating fiscal challenges. Figures 4a and 4.b illustrate the economic and fiscal impacts of aging populations through pensions and healthcare spending.
Figure 4a: Net Present Value of Pension Spending 2021-50 (estimated % of GDP)
Figure 4b. Net Present Value of Healthcare Spending 2021-50 (estimated % of GDP)
Source: OMFIF (2023), based on IMF, Macrobond.
Note: The United Nations Population Fund definition holds that there is a demographic dividend, i.e. a period of accelerated economic growth that may occur when a country has a growing population of workers, because they are productive generators of economic wealth.
3.2 Economic Stagnation
Population dynamics have the potential to adversely impact the economic growth of countries. Per-capita income growth reflects the total number of discoveries. These, in turn, depend on the total number of people involved in the process of searching for these ideas, led by researchers, scientists, and entrepreneurs. Jones (2023) noted, “in the long run, the growth in the number of researchers and entrepreneurs is limited by the population growth rate because the share of people doing research must level off. Growth in living standards in countries at the world frontier is ultimately tied to the population growth rate of the countries that produce ideas.”
Maestas et al (2023), using data from U.S. states, estimated that a 10% growth in the fraction of the population aged over 60 (equivalent to a 2.4 percentage point increase in this fraction), reduces per-capita GDP by 5.5% over a 10-year period. Furthermore, two-thirds of this decline comes from reduced labor productivity growth, while one-third is due to lower per-capita employment growth.
There is an additional complication in terms of maintaining the flow of ideas and productivity growth. Relatively young people, aged under 50, are responsible for this process. Jones (2005) collected information on Nobel Prize winners in economics, physics, medicine, and chemistry (from 1900 to 2003), and on individuals who made significant inventions in various fields, including communication, electronics, computing, and medicine, emphasizing that 86% of contributions to knowledge in the twentieth century were made by individuals aged under 50.
When it comes to entrepreneurs, the situation is similar. Liang et al (2014) concluded that “having too many older workers in society slows entrepreneurship” and “a one-standard deviation decrease in the median age of a country increases the rate of new business formation by 2.5% percentage points.” Azoulay et al (2018) used administrative and confidential data from the U.S. Census Bureau and found that “the average age of entrepreneurs at the time they founded their companies is 42” and “among the top 0.1% of startups based on growth in their first five years, we find that the founders started their companies, on average, when they were 45 years old […] and founder age is similarly high for those startups that successfully exit through an IPO or acquisition.”
To continue leading scientific discoveries, innovations, and entrepreneurship, and consequently gain productivity, high-income countries will have to find alternatives to compensate for the lack of relatively young individuals, those under 50 years of age, in society.
- THE CONUNDRUM FACED BY IMMIGRATION POLICIES IN HIGH-INCOME COUNTRIES
One alternative for high-income countries to maintain leadership in scientific discoveries, innovations, and entrepreneurship is to increase the influx of immigrants, young and qualified, or capable of acquiring human capital, to lead this process. From the standpoint of middle- and low-income countries, there is the concomitant risk of losses derived from ‘brain drain’, with poorer countries losing human capital to richer ones (Beine et al, 2001). With population decline, and the corresponding risks of a gerontocratic fiscal trap and economic stagnation, the costs for developed countries of not being more flexible in their immigration policies will increase.
Estimates by Artus (2023) pointed to net immigration increasing U.S. employment by 1% per year from 1990 to 2022. Assuming an elasticity of two-thirds of real GDP to employment, that would mean increases in real GDP by 0.67% per year. The cumulative increase in GDP due to immigration between 1990 and today would therefore be 22.3%.
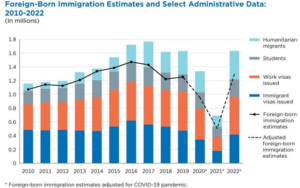
Several authors have pointed out how the rebound in U.S. net immigration since the pandemic has been a major factor behind the surprisingly strong and durable economic recovery of the country (Smith, 2024). The resumption in visa processing in 2021 and 2022 made it possible for foreign-born workers to fill some gaps that remained across industries and locations after the pandemic shutdowns (Canuto, 2022).
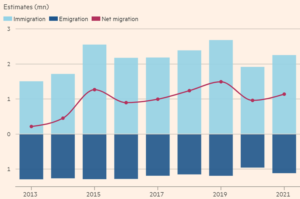
Figure 5 shows the recent evolution of the U.S. foreign-born immigration estimates. Currently, 18.6% of the U.S. labor force is comprised of foreign-born workers (DePillis, 2024).
Figure 5
Source: Smith (2024).
Net immigration into the 27 countries that comprise the European Union has also kept pace (Figure 6). Notwithstanding the fact that the success of the campaign for Brexit in 2016 was to some extent grounded in the idea of restricting foreigners’ rights to come to the UK, net immigration to the UK rose recently, beyond the one-off effects of admitting large numbers of Ukrainians and people from Hong Kong for humanitarian reasons (Beattie, 2024).
Figure 6: Immigration into the EU27
Source: Beattie (2024).
The recent immigration surge has happened despite rising sentiment against immigration among the populations of many high-income countries. This has been the case already for some time regarding small groups of migrants, such as those seeking asylum, as well as illegal immigration. The rise of political parties in Europe and politicians in the U.S. in favor of clampdowns on asylum seekers and reinforcement of border controls reflects that.
Many high-income countries have faced a conundrum: politicians promising to cut immigration, while governments and businessmen know how economically costly the absence of immigrants would be (Haas, 2023). Western governments are generally allowing immigration while fighting culture wars, as well as trying to curb illegal immigration and the arrival of asylum seekers. If hostility towards receiving foreigners, aiming to preserve cultural traditions and greater societal homogeneity, prevails over actual immigration flows, the economic costs will be high, according to what we have discussed.
It is worth examining the case of Japan, a country that is more advanced in experiencing population decline and aging, serving as a template for many other nations.
- THE EXAMPLE OF JAPAN
The Japanese case is interesting because it’s a country that has been experiencing the effects of a declining population for several years, serving as an example for various nations facing similar situations in the coming decades.
Japan’s population peaked in 2009, reaching just over 128 million inhabitants. Projections suggest that this number will decrease by a little over 40%, dropping to about 74 million by 2100. The country already experiences population decline across all age groups, except for the elderly (above 64 years). As a result, the dependency ratio was 71.12% in 2021, and is expected to reach 99.74% by 2100. This implies that, by the end of the century, there will be practically one individual actively participating in the workforce, the source of government revenue, for each dependent—the sum of children under 15 and seniors over 64.
From 1990 until the COVID-19 pandemic, in growth accounting, the contribution of the labor factor was never positive and was negative in 24 out of 29 years. Additionally, Japan has the lowest estimate of potential GDP among its peers, reflecting lower productivity growth. Since the 1990s, it has recorded low rates of both GDP and GDP per capita growth compared to its peers (U.S., UK, Germany) and its post-Second World War history.
Between 1990 and 2023, the share of social security spending in total expenditures jumped from 17.5% to 32.3%, becoming the most significant item in the government’s budget. On one hand, Japan has one of the lowest Gross Replacement Rates in the OECD[9]. On the other hand, it has the world’s second-highest life expectancy after Monaco. Its social security spending as a proportion of GDP ranks only fourteenth highest globally.
Japan relies heavily on debt to finance its fiscal imbalance. As a result, it has the highest net debt as a percentage of GDP among developed countries, and one of the highest globally (156.9% in 2023 vs. 98.3% for the U.S.)[10]. Despite such a high level, Japan’s interest rates have been the lowest globally, often facing deflation more than inflation. It helps that the Japanese have high savings rates and a bias toward allocating their resources in the Japanese market. For instance, almost 90% of government debt is held locally.
It’s important to remember though the warning from Eichengreen (2011): “Investors may be lulled into complacency for a time by the government’s promise to put its fiscal house in order […] But one morning they will wake up with a start and conclude that the debt is unsustainable. They will sell its bonds en masse, and its currency will collapse on the foreign exchange market.”
Japan´s FR fell below 2.1 in 1974 and has not returned to that level. In 1996, the government signaled for the first time that it considered its FR “too low” when it was 1.43. The FR continued its downward trajectory until 2005, reaching 1.27, its lowest historical level. Two years earlier, in 2003, the government set the policy goal of increasing its FR when it was 1.29. It started rising in 2005 and reached 1.43 in 2016. Then, it fell again and reached 1.3 in 2021. As mentioned earlier, many policies aimed at increasing fertility tend to follow this trajectory—they have an initial positive effect, often stimulating parents to advance their childbearing plans to receive government benefits. This effect fades, and the FR drops again.
Finally, concerning immigration, Japan has a history restrictive policies on admitting foreigners to the country. This is reflected in the small percentage of the population born in another country: 1.61% in 2015. There are incipient signs of a more favorable stance toward immigrants from the government. In 2023, it openly declared the goal of bringing in foreigners to work in industries facing a shortage of Japanese workers. In twelve sectors, including manufacturing, hospitality, and restaurants, immigrants with certain qualifications can enter Japan, along with their family members, and can stay in the country for as long as they wish (WSJ, 2023).
The government’s immigration policy rationale does not consider as objectives addressing the long-term decline in the population size, or tackling population aging. In 2022, Japan already reached a record for residents born in another country, with just over three million people[11].
It’s interesting to note that, in comparison with its peers, the Japanese have a favorable view of immigration. In a 2018 survey by the Pew Research Center in 18 countries, 59% believed that immigrants strengthen the country due to their work and talent (vs. 56%, 50%, and 12%, respectively, for France, the Netherlands, and Italy). On the other hand, 31% consider immigrants a burden because they take jobs and social benefits from locals (vs. 39%, 42%, and 54%, respectively, for France, the Netherlands, and Italy)[12]. This favorable perspective is somewhat surprising. Typically, polls indicate that countries with fewer immigrants tend to exhibit a greater prevalence of xenophobic attitudes among their populations (Hass, 2023).
It may be that, further down the line, when the costs of population decline and aging become even higher, the government will adopt more immigration-friendly policies. The alternative could be an “empty country” (Bricker and Ibbitson, 2019; Jones, 2020).
- CONCLUSION
Most high-income countries will experience declines in their populations over the next few decades, while immigration may be a way to mitigate the tendency. Population aging will occur unless situations change significantly. Some negative consequences of aging are on the horizon: greater fiscal imbalances and the risk of economic stagnation. As these costs increase over time, one possibility is that policymakers in high-income countries may veer toward the adoption of less-stringent immigration restriction policies, notwithstanding the ongoing political wave that is unfriendly to such policies. Discrimination against specific groups of potential immigrants may also predominate.
The source of new young people in the future will be Africa and Asia. Investing in the human capital of these individuals to not squander these scarce talents is a significant policy implication for the coming decades, to enable the expansion of the technological frontier and avoid, for example, the risk of economic stagnation. In other words, qualifying this contingent of future adults in their prime should be the priority of world society, alongside tackling climate change. That would also minimize the consequences of brain drain on non-high-income countries.
For a certain period, it is possible that countries facing demographic decline will compensate for the lack of young people with robots: in other words, expanding automation in the production process. In fact, this process is already occurring more forcefully in countries with more advanced population aging, such as Japan. It is likely to be accelerated with the demographic transition ahead. The lower supply of labor will raise its price relative to robot prices, and incentives for innovation and automation will naturally rise. This movement will prevent the decline in the economic growth rate. However, it does not prevent the lowering of potential growth in the medium term for two reasons: (i) invention is at least until now labor-intensive, and (ii) resources shift from innovation to automation.
Beyond less-restrictive immigration policies, high-income countries should focus on utilizing their resources more efficiently. Talents at home that could be involved in generating new ideas are wasted, either through inequality of opportunities or discrimination. In the United States, over 70% of individuals accepted into the top 100 universities in the country come from the 25% richest families. Only 4% come from the poorest 25% (Sandel, 2020). White men were 94% of doctors, lawyers, and executives in the U.S. in 1960, decreasing to 60% in 2010. In turn, 4% of inventors of new patents were women in 1976, reaching 12% in 2020 (Jones, 2023). The effects of better talent allocation over time can be significant. According to estimates by Hsieh et al (2019), it explains 40% of per-capita income growth in the United States over the last 50 years.
Recent technological advancements, such as artificial intelligence (AI), have the potential to greatly amplify society’s capacity for innovation. There exists the possibility of machines surpassing humans in cognitive abilities, thereby generating ideas, and pushing the boundaries of growth constrained by the quantity and quality of human capital available. However, AI also brings challenges in relation to jobs, income distribution, and government functions (Canuto, 2024; Peixoto et al, 2024). In the face of uncertainty about the realization of this scenario, emphasis should be placed on expanding the universe and nurturing the quality of human capital among young prospective immigrants, and the populations of low- and middle-income countries generally.
Appendix – Table A1. List of Countries by Groups According to FR

References
- Acemoglu, D. and Restrepo, P. (2017). “Secular Stagnation? The Effect of Aging on Economic Growth in the Age of Automation”. American Economic Review: Papers & Proceedings, 107(5).
- Agenor, P.-R. and Canuto, O. (2015). “Gender equality and economic growth in Brazil: A long-run analysis”, Journal of Macroeconomics, Volume 43, March 2015, p. 155-172.
- Artus, P. (2023). “What kind of growth would the United States have seen if there had been no external borrowing and no immigration since 1990?”, Flash Economics, Natixis, October 27.
- Azoulay, P. Jones, B. Kim, J. and Miranda, J. (2018). “Age and High-Growth Entreperneurship”. NBER Working Paper #24489.
- Barro, R. (1990). “Government Spending in a Simple Model of Endogeneous Growth”. Journal of Political Economy 98(S5): 103-125.
- Basso, H. and Jimeno, J. (2020). “From Secular Stagnation to Robocalypse? Implications of Demographic and Technological Changes”. Journal of Monetary Economics, 117(1), June.
- Beatie, A. (2024). “The Immigration Smokescreen Is Beginning to Lift”, Financial Times, January 11.
- Beine, M.; Docquier, F.; and Rapoport, H. (2001). “Brain drain and economic growth: theory and evidence”, Journal of Development Economics, Volume 64, Issue 1, p. 275-289.
- Bricker, D. and Ibbitson, J. (2019). “Empty Planet: The Shock of Global Population Decline”. Crown Publishing Group.
- Canuto, O. (2022). “Whither the Phillips Curve?”, Policy Center for the New South, Policy Paper PP – 17/22, October.
- Canuto, O. (2024). “How Will Artificial Intelligence Affect the Economy?”, Policy Center for the New South, January 26.
- DePillis, L. (2024). “The U.S. Economy is Surpassing Expectations. Immigration Is One Reason.” New York Times, February 29.
- Douthat, R. (2023). “How Gerontocracy Explains the Matt Gaetz Clown Show”. New York Times, October 4th.
- Eichengreen, B. (2011). “Exorbitant Privilege: The Rise and Fall of the Dollar”. Oxford University Press.
- Franz, J. (2024). “How population decline could upend the global economy”. Capital Ideas, March 14.
- Hass, H. (2023). “How Migration Really Works: The Facts About the Most Divisive Issue in Politics”. Basic Books.
- Hsieh, C. Hurst, E. Jones, C. and Klenow, P. (2019). “The Allocation of Talent and the US Economic Growth”. Econometrica, Volume 87, Issue 5, September.
- IMF (2023). “Fiscal Monitor – Climate Crossroads: Fiscal Policies in a Warming World”. Climate Crossroads Fiscal Policies in a Warming World (imf.org)
- IOM (2022). “World Migration Report”. World Migration Report 2022 | IOM Publications Platform
- C. (2020). “The End of Economic Growth? Unintended Consequences of a Declining Population”. NBER Working Paper #26651.
- Jones, C. (2022). “The Past and Future of Economic Growth: A Semi-Endogenous Perspective”. Annual Review of Economics, August 14th, 125-152.
- Jones, C. (2023). “The Outlook for Long Term Economic Growth”. NBER Working Paper #31648.
- Jones, C. (2023a). “The A.I. Dilemma: Growth versus Existential Risk”. NBER Working Paper #31837.
- Jones, B. (2005). “Age and Great Invention”. NBER Working Paper #11359.
- Liang, J. Wang, H. and Lazear, E. (2014). “Demographics and Entrepreneurship”. NBER Working Paper #20506.
- OMFIF (2023). “Demographics are not destiny, but they can set parameters.” OMFIF Bulletin, Summer.
- Peixoto, T.; Canuto, O.; and Jordan, L. (2024). “AI and the Future of Government: Unexpected Effects and Critical Challenges”, Policy Center for the New South.
- Sandel, M. (2020). “The Tyranny of Merit: What`s Become of the Common Good?”. Publisher: Farrar, Straus and Giroux.
- Smith, N. (2024). “Did immigration bring down inflation?”, Noahpinion, March 3.
- (2009). “Human Development Report – Overcoming Barriers: Human Mobility and Development”. human-development-report-2009-english.human-development-report-2009-english (undp.org)
- United Nations. (2021). “World Population Policies 2021 – Policies Related to Fertility”. undesa_pd_2021_wpp-fertility_policies.pdf
- WSJ – Wall Street Journal (2023). “Even Japan Wants More Foreign Workers, and It is Letting Them Stay for Good”. June 9th.
Eduardo de Carvalho Andrade, based in Washington, D.C., serves as an economic consultant at AndradeNomics, the company he founded. Previously, he held the position of Chief Economist and Partner at Apex Capital, an equity fund headquartered in São Paulo. Prior to that, he was an associate professor at Insper, one of the top business and economics schools in Brazil. He has also held visiting researcher positions at the University of Chicago, the Center for International Development at Harvard University, and the University of New South Wales in Sydney, Australia. Additionally, he served as a visiting professor at Universidad Carlos III de Madrid in Spain. He has authored publications in international journals and contributed articles to leading newspapers in Brazil. He holds a B.A. and a MSc in economics from the Catholic University in Rio de Janeiro, and a PhD in economics from the University of Chicago.
Otaviano Canuto, based in Washington, D.C, is a former vice president and a former executive director at the World Bank, a former executive director at the International Monetary Fund, and a former vice president at the Inter-American Development Bank. He is also a former deputy minister for international affairs at Brazil’s Ministry of Finance and a former professor of economics at the University of São Paulo and the University of Campinas, Brazil. Currently, he is a senior fellow at the Policy Center for the New South, a distinguished visiting scholar at the Elliott School of International Affairs – George Washington University, a nonresident senior fellow at Brookings Institution, a professor affiliate at UM6P, and principal at Center for Macroeconomics and Development.
[1] For more details, see UNDP (2009) and IOM (2022).
[2] For a discussion on the quality of population size projections over time, see https://ourworldindata.org/population-projections.
[3] The analysis will be restricted to countries with more than one million inhabitants in 2021.
[4] Term used by Douthat (2023).
[5] The only exceptions are Sierra Leone (FR of 3.98), East Timor (3.15), and Lesotho (3.02). These last two have fertility rates close to the threshold (of 2.9 in 2021) at which the population will eventually decline.
[6] In order to compare countries, the data source used is the same for all countries, “UN World Population Prospects” via “Our World in Data”. Based on this data, the population of the U.S. will continue to grow until the year 2100. However, according to the latest data released by the U.S. Census in 2023, its projection suggest that the U.S. population will peak in 2080. In this case, the U.S. would be a member of Group 2.
[7] See United Nations (2021) for a survey on these strategies.
[8] The source of the data is UN, World Population Prospects (2022) – processed by Our World in Data.
[9] The gross replacement rate is defined as the individual gross pension entitlement divided by gross pre-retirement earnings.
[10] See https://www.mof.go.jp/english/policy/budget/budget/fy2023/02.pdf.
[11] See https://www.japantimes.co.jp/news/2023/03/25/national/foreign-residents-japan-increase-2022/.
[12] See https://www.pewresearch.org/global/2019/03/14/around-the-world-more-say-immigrants-are-a-strength-than-a-burden/.