Policy Center for the New South, August 2021, PB-21/29
Also: Seeking Alpha, TheStreet.com, Affluent Society, and Capital Finance International
Introduction
Macroeconomic dynamics in the U.S. economy—and arguably also in other advanced economies—has increasingly become associated with asset price fluctuations in the past few decades. Financial conditions have increasingly become an influential factor shaping the cyclical pace of the macroeconomy.
There has been a mismatch between rising financial wealth and the pace of creation and incorporation of new assets. Along with macroeconomic and financial fluctuations, net financial wealth has on average grown over time at a faster pace than the stock of productive assets added to the real economy.
That mismatch has endured via upward reevaluation of existing assets and increased public debt. Occasional moments of asset price adjustment downward have been followed by new rounds of finance-led booms. Bubble-blowing—i.e., asset appreciation beyond ‘fundamentals’ values —has become a major driver of macroeconomic performance.
The mismatch between financial wealth growth and real-side asset accumulation has happened in tandem with declining long-term interest rates, as well as rising ratios of debt and household net worth to GDP. One reason for sliding interest rates is the abundance of stocks of financial wealth in search for yield relative to investment opportunities created by the addition of new assets. At the same time, as a feedback loop, lower interest rates have supported the appreciation of outstanding financial assets by reducing discount rates applied to future earnings. The size of the private-sector balance sheet has risen relative to GDP, with rising private and public debt accompanying rising private net worth.
Several secular stagnation hypotheses—driven by demographics, technological evolution, and income concentration—offer explanations for the insufficient creation of new assets. Public debt—and its partial monetization by central banks—has played a stabilizing role by boosting the net supply of assets available to accommodate the demand for financial assets.
Therefore, the U.S. big balance sheet economy has been on a growth path highly dependent on the continuity of low real interest rates, as well as stretched price-earnings ratios of stocks and high corporate debt. Periodic episodes of downward adjustment of asset prices have been countervailed with lax monetary policies.
Fiscal deficits and public debt can extend the life span of such dynamics in two ways. First, fiscal deficits can boost the return of private assets by lifting profits and thereby stimulate the creation of new assets. Second, higher public debt widens the outlays to accumulate private financial wealth. In the absence of fiscal deficits and public debt expansion, the underlying mismatch between financial wealth and the real-side economy comes to the fore.
Apart from occasional asset-price and balance-sheet adjustments—accompanied or not by financial crises—the extension of the finance-led macroeconomic growth will depend on the extent to which factors leading to the relative insufficiency of new productive assets are reversed, while interest rates remain low. As well established by Blanchard (2019), if there is no major change in the perception of government default risks, public debt-to-GDP ratios would not rise if GDP growth rates were higher than interest rates. Such GDP performance would depend on the extent to which fiscal policy translates into lifting the accumulation of new productive assets. Otherwise, the U.S. economy will stay on a bubble-led growth-cum-cycle trajectory, with moments of—highly or less disruptive—financial stress.
- Finance and Macroeconomics: Macro-Financial Linkages
Finance and macroeconomic activity have a two-way relationship. Assets and liabilities are stocks—at a moment in time—that reflect investors’ expectations about future flows of returns as well as the ability and willingness of money receivers to comply with obligations. All this seasoned with varying degrees of confidence on such expectations. Over time, in turn, the actual path taken by the macroeconomic activity feeds back—positively or negatively—on finance.
Only under conditions of perfect financial markets and unique, stable, and gravitational properties of equilibrium conditions on the economy side might one find a unidirectional relationship between finance and the real side of the economy. Otherwise, their interaction will always take place as interdependent but distinctive spheres.
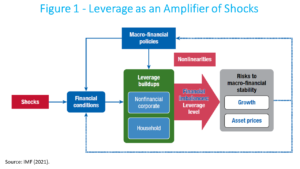
Finance can lead the macroeconomic activity through leverage (i.e., debt in relation to income) or acquisition of shares, with both cyclical and structural consequences. Figure 1, taken from the IMF’s April 2021 Global Financial Stability Report, depicts the connections between leverage, financial conditions, and macro-financial stability, which are closely intertwined. Financial conditions, usually measurable or observable by a series of indicators, reflect the price of risk and liquidity in an economy, and it constitutes a key driver of leverage buildups. When financial conditions are loose, intermediaries and markets have a greater incentive to take on more risk and a greater proclivity to lend. At the same time, borrowers (firms and households) have a greater propensity to take on debt and, through heightened net worth associated with higher asset values, a greater capacity to borrow.
As financial development occurs—and a larger share of economic assets is incorporated into the financial system—the finance-led macroeconomic leadership strengthens. In the sense used by John Maynard Keynes that, in a complex system, one may regard as the causa causans that factor which is most prone to sudden and wide fluctuation (as he did with respect to investment as the causa causans of variations in income and employment (Keynes, 1937)).
Leverage buildups may lead to a financial vulnerability, as high levels of indebtedness mean households and firms become more susceptible to adverse shocks. When these shocks arise and financial conditions tighten, financial stability risks may arise from any sudden correction of asset prices and abrupt deleveraging by firms and households.
The combination of risk repricing and high leverage may well spark nonlinearities, whereby tighter financial conditions interact with deleveraging, which in turn causes additional repricing of risk. The higher the level of indebtedness—including degrees of time mismatches in balance sheets—before the shock, the greater the likelihood of such deleveraging becoming highly disruptive. That is why the IMF observes that leverage, while making possible a ramp up of real economic activity, can also act as an amplifier of adverse shocks. It is a double-edged sword.
Degrees of confidence are embodied and embedded in financial conditions. Hyman Minsky (1986) wrote about how leverage followed cycles of boom and bust. In periods of stability, as time passes without crises, economic agents tend to feel more secure to raise leverage. Until, systemically, the underlying macro-financial stability becomes fragile enough to succumb to any shock, after which the unwinding of leverage—happening with non-linearities—leads to a crisis, often with fire sales of assets, and illiquidity possibly turning into insolvency. Financial conditions could well be the locus where to find Hyman Minsky’s changes of moods about uncertainty and confidence.
Macro-financial policies (monetary, macroprudential, and fiscal) also influence leverage buildups, either through financial conditions and the availability of credit or through the effects of policies on factors such as income, unemployment, inflation, and debt service costs. Macroprudential policies can help to lean against the wind—that is, tighten to lessen risks to future financial stability (Canuto and Ghosh, 2013). These policies can accomplish this objective by taming leverage buildups and/or by strengthening borrower and lender resilience.
- Asset-Driven Macroeconomics Cycles…
In the last 30 years, we have seen three major U.S. asset-driven business cycles, with macroeconomic activity being lifted and then hit by large macroeconomic shocks arising from the financial side. On Figure 2, notice the ascent of the net worth of US households vis-à-vis GDP, particularly during booms.

The U.S. business cycles that ended in the last three recessions involved progressively greater and more troubling risk-taking behavior. Each ended with worse financial fallout and a longer period of recession and weak recovery.
A similar bubble-led growth process could be found inside the euro zone. Starting with the downward convergence of perceived risks and interest rates throughout the zone after the introduction of the new common currency. Countries that later ended up under stress were able to sustain domestic absorption much above domestic production capacities for a long period, easily financing the difference—current-account deficits—because of fallen-from-heaven domestic asset value appreciation and external bank credit. The underestimation of fiscal risks by market participants can also be seen as a manifestation of such euphoria.
Asset-price dynamics has now been mainstreamed as an important subject to be addressed by policymakers. Macroprudential policies are now a component in the macroeconomic stabilization toolkit (Canuto, 2021a, ch.18).
- … and Tendency: Household Net Worth and Private Debt (the Big Balance Sheet Economy)
There were also structural trends taking place as the finance-led cycles unfolded. Figure 3 shows that the total value of household assets rose relative to income along the cycles depicted on Figure 2. Property values leading the cycles—including stock market assets, and houses, as highlighted therein—went up relative to income.
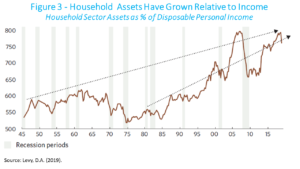
David Levy (2019) refers to the “big balance sheet economy era” in the United States (mid-1980s to present) as a period in which private sector balance sheets became disproportionately large enough to have a powerful influence on consumer and business behavior and on the business cycle, significantly changing the behavior of the economy.
With the company of rising debt. Figure 4 shows a broad measure of private sector indebtedness in proportion to the size of the economy’s income (GDP). Private nonfinancial debt corresponds to the debt of households (including mortgages and personal credit) and non-financial corporates, while government and financial firms are the other sectors. This ratio rose more than four-fold from 1945 to its peak in 2009.
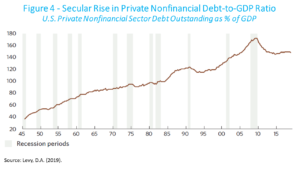
Some categories of debt have declined relative to income, but others have risen. The household sector debt-to-income ratio changed its path from its housing bubble excesses in the wake of the great recession and has continued to trend lower. However, the nonfinancial corporate sector’s debt-to-gross-value-added ratio kept rising toward a new all-time high (BIS, 2021).
Private sector balance sheets grew faster than income over many decades. Aggregate debt grew faster than aggregate income, but also aggregate assets grew faster than aggregate income, with a corresponding rise in net worth relative to GDP as a trend.
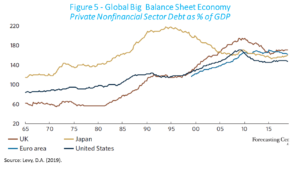
Figure 5 shows how a few other advanced economies in the rest of the world also displayed rising levels of private nonfinancial sector debt to GDP until the global financial crisis, with Japan reaching a peak before, when it faced its “balance sheet recession” (Koo, 2011). Although the pervasiveness and diversity of finance differs among advanced countries—particularly on the roles of banks and non-banking financial intermediation—one may notice the increased role played by private nonfinancial sector debt.
- Declining Long-Term Interest Rates
The rise of debt and balance sheets relative to U.S. GDP has been accompanied by a steady decline of long-term real interest rates (Figure 6). The price of money—either for liquidity, share purchases, or credit—like any price, is determined by the balance of supply and demand. So why has the price of money—measured by inflation-adjusted 10-year or 30-year real interest rates—fallen so steeply over the past few decades, in the U.S. and other advanced economies?
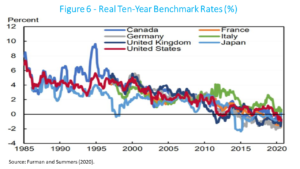
In principle, the rate decline must have one of two explanations: too much supply of money from savers or money holders or too little demand for money from investors. Or, of course, some of each.
A possible explanation may be found in an excess of accumulation of financial wealth relative to the creation or addition of new assets, taking net investment ratios to GDP as a proxy of the latter. As we consider below, private financial wealth found on the appreciation of outstanding assets—and public debt—ways to grow beyond net stocks of economic assets. Just to consecutively keep reinstating the mismatch between financial wealth searching for yield and investment opportunities.
Interest rates, despite being a monetary phenomenon, end up anchored in real terms by single or possibly multiple levels determined in the interaction between finance and the real side of the economy. The downward trend exhibited in Figure 6 may well reflect an average pace of increases of financial wealth over and beyond the incorporation of new assets to the economy leading to excess financial resources made available. In turn, as part of a feedback loop, falling interest rates lifted the value of wealth as the discounted sum of future income, with a corresponding rise of the size of private balance sheets relative to the real economy.
How about the role of monetary policies by central banks? Typically, central banks peg short-term interest rates and try to influence the whole yield structure of interest rates to manage aggregate demand and keep inflation on target. They—or other dedicated institutions—also deal with the stability of financial markets and institutions.
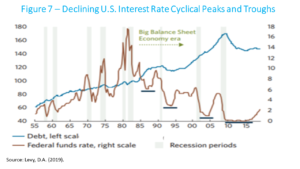
Real levels of policy rates established by central banks in their aggregate demand management tend to accommodate to such structural long-term determinants. Notice in Figure 7 how the short-term interest rates established by the Federal Reserve Bank followed a trend of decline along its cycles of hike and descent, with decreasing peaks and troughs along those cycles. Central Banks set their basic short-term interest rates following their inflation targets and they move rates counter-cyclically relative to ups and downs of economic cycles, as these phases come with corresponding inflationary or deflationary pressures.
One major factor leading to lower interest rates was a change in the inflation landscape toward lower inflation rates since the 1980s. There are several explanations for that: trade globalization, including a period with devalued exchange rates of China and other Asian exporters of manufactures provided favorable price shocks via imports to the US and other advanced economies; lower bargaining power of workers led to weaker pressure for higher wages during phases of low unemployment, flattening the Phillip’s Curve and allowing markups to rise without creating inflationary pressures (Kim et al, 2019); and success and credibility of central banks’ inflation targeting regimes would also have stabilized the private agents’ expectations about inflation, etc.
Furthermore, as debt ratios grew rapidly in this era, they would also have helped the cyclical peaks of the federal funds rate to be progressively lower, as financial stress emerged at lower interest rates in each cycle from the 1980s onward.
Low and declining short-term and long-term interest rates were accompanied by a private nonfinancial debt rise until at least the global financial crisis of 2008-2009. A rising debt ratio meant not only a falling ceiling for interest rates, but also a falling trend of cyclical interest rate peaks and bottoms as each successive recession and financial crisis required lower rates to enable the economy to regain financial stability.
- Secular Stagnation and Investment Drought
We have so far highlighted the role of asset bubbles pulling up the growth trajectory, happening in tandem with declining long-term interest rates, as well as rising ratios of household net worth and of debt to GDP. With a possible explanation being a mismatch between the paces of financial wealth accumulation and of creation/incorporation of new assets.
Such a mismatch can be seen in Figure 8, where net fixed investment is displayed side by side with nominal holding gains on household assets. Net fixed investment in equipment, software, building structures, etc. (net meaning new investments minus the depreciation of old investments) for private, domestic businesses—as a percentage of GDP—has been small in recent times, particularly after the global financial crisis. In turn, asset price gains have been considerable over the course of the expansion.
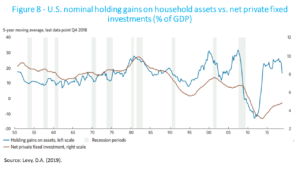
Secular stagnation hypotheses—subject below—offer different explanations for such a low-profile taken by net private fixed investments, despite low financial costs and GDP growth.
The swelling of the asset side of private balance sheets during the 2010s expansion has been notable. Asset prices across a wide range of categories have risen. The pressures of the Big Balance Sheet Economy have once again compelled investors to bid prices of whatever existing assets to substantial heights. A point made by David Levy on what he calls a “big balance sheet economy” is that such disproportionate balance sheet expansion changed financial parameters in the economy, making financial activity compelled to take riskier behavior (Levy, 2021) —as stated earlier by Minsky (1986).
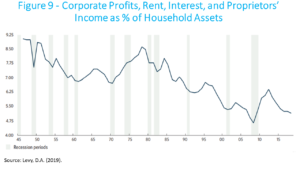
The superabundance of financial wealth—capital if you will—relative to investment opportunities can also be gauged in declining operating rates of return (Figure 9). Current capital income—the sum of corporate profits, noncorporate business income, rent, and interest—fell relative to assets. Part of the shrinkage of current income relative to assets was caused by falling interest rates, of course, but a feedback loop is possibly also part of the story, as lenders and buyers of fixed-income securities have had to accept lower yields or purchase riskier assets.
Rates of operating returns on non-interest-bearing assets also declined, as the falling interest rates helped to increase valuations. The capital appreciation also had an unfavorable consequence. Investors not only faced falling interest rates on debt instruments and cash deposits, but also falling rates of operating returns on investments aside from interest-earning assets, including net rental income on commercial property and profits on corporate equity.
What if some underlying secular trend of stagnation is underway, making the economic dynamics dependent on the balance sheet economy getting bigger and bigger? If the growth trend is dependent on the overspending induced by the financial frenzy—credit and house-price bubbles—avoiding future asset price booms and busts might simply lead to stability around low growth rates.
Such a view underlies the possibility of a secular stagnation trend mentioned by economists like Paul Krugman (2013) and Lawrence Summers (2013). They and other—say, Keynesian—economists have suggested an array of possible causes for the U.S. economy and others to display a propensity for aggregate demand shortfalls, in the sense that, as a result of structural conditions, aggregate spending would not be enough to ensure full employment and use of potential output capacity unless real interest rates become negative (or, alternatively, very low interest rates for long periods and central banks’ bloating of balance sheets by asset acquisition).
Such an ‘investment drought’—or, as a flipside, a ‘savings glut’ as measured by levels of non-consumption expenditures required to sustain income at full employment—could be seen as underlying the fact that, despite the extreme looseness of monetary policies since the global financial crisis, average economic growth rates have fallen short of the levels of previous decades. This has been the case in the U.S., where average growth has been lower, even if there was a long period without any recession until 2020.
Several long-standing factors could be pointed out as dampening investment. Among them, one may single out the following:
First, rising income concentration—rising shares of income accruing to capital and the very wealthy—would lead to overall under-consumption, only occasionally countered by unsustainable over-indebtedness of poorer segments of the income pyramid. Aggregate demand would have become far too reliant on debt.
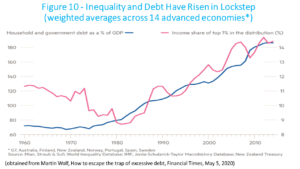
Beyond a point, inequality weakens an economy by driving policymakers into a difficult choice between high unemployment or ever-rising debt. This phenomenon of rising household debt and rising inequality is not unique to the US. It is widespread, judging by the weighted average displayed in Figure 10.
The argument about inequality leading to secular stagnation because of lack of sufficient aggregate demand does not depend on a ‘savings glut’ being created and then searching investment opportunities. It corresponds to a waste of not fully using the installed GDP capacity over time, eventually bringing down investment rates.
Demographic changes are also pointed out as potentially leading to an investment drought or savings glut. Decreased mortality and increased longevity are changing the demographic structure in advanced economies, affecting both demand—through increased savings—and supply, through reduced innovation activities.
Features of technology evolution might also be contributing to an investment drought. Steep declines in the costs of durable goods—especially those associated with information and communication technology and/or outsourcing—would mean lower spending levels associated with investment plans financed from corporate savings. Furthermore, the trajectories of technological evolution currently unfolding would not carry an array of high-return investment opportunities comparable to past ones.
Cowen (2013) approached stagnation as an outcome of the exhaustion of a significant set of ‘low-hanging fruits’ reaped in recent history, namely one-off supply-side opportunities associated with post-war reconstruction, trade opening, diffusion of new technologies in power, transport, and communications, educational attainments, and others.
Think of the whole set of fixed-capital and infrastructure investments associated with the second industrial revolution starting at the end of the nineteenth century and fully developed in the last century. Nothing comparable in terms of physical, tangible investments—and backward and forward cross-sector linkages—can be found in the technological revolution in course, even if it also increases productivity.
The rising importance of intangible investment as a share of total investment in economies across the world, in addition to greater global integration, is also part of the explanation. Intangible investment, which includes investments in certain types of technology but also improvements in business processes, economic competencies, and branding, are distinct from tangible investment typified by plants and equipment; they are more scalable, have more synergies, and have other defining features (Lall and Zeng, 2020).
A higher share of intangible investment embeds a greater degree of scalability in production. In turn, this implies that economic output can increase or decrease more in response to shocks or even policy measures without necessarily exhibiting the same degree of price changes as has been in evidence in the past and without creating demand for fixed capital.
There are also the arguments of lower bang-for-the-buck in terms of productivity increases from ongoing technological trajectories (Gordon, 2014). Such a hypothesis—like Tyler Cowen’s—would be compatible with declining investment rates and lower growth potential, regardless of whether leading or not to chronic insufficiency of aggregate demand.
- The Pandemic
Then comes the pandemic, the financial shock in March 2020, and the adoption of extraordinary fiscal and monetary-financial policies (Canuto, 2021a, Ch. 23). The extraordinary monetary and fiscal policy support launched during the containment phase of the pandemic eased market dysfunction, loosening financial conditions after a sharp tightening in the first quarter of 2020, and maintained the flow of credit to households and firms.
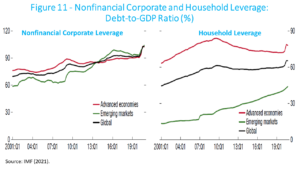
Regardless of distinctive sectoral performances, one may say that overall trends depicted here have been exacerbated, even if in a one-shot, non-repetitive manner (Figure 11). The pandemic shock has further increased non-financial sector leverage across economies, even if for different reasons. The crisis has squeezed cash flows for the corporate sector and, through its impact on employment, increased the financing needs of households. Still to be seen the extent to which the overall transfer from the public sector to households will lead to higher private savings for some while others have simply increased leverage. The distinctive asset appreciation at this latest stage of finance-led macroeconomic performance has obviously been the high-tech sector and others less impacted by the pandemic crisis, while non-financial corporate and household leverage partially prevented the downfall.
- Fiscal Spending, Public Debt, and Central Banks
To what extent have current account transactions and fiscal balances helped sustain domestic aggregate demand in the U.S. case? And to what extent may fiscal deficits and public debt help fill current demand and asset gaps?
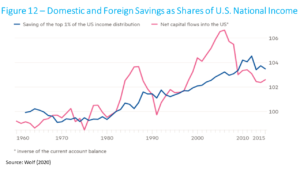
Globally, it is in the U.S. where global demand and supply have balanced (Wolf, 2020). The rest of the world has sought to accumulate U.S. assets, and so generated a persistent U.S. current account deficit. Except when the pre-financial crisis housing bubble drove up private investment, this has also remained too weak (Figure 12).
More recently, neither foreign credit to households nor acquisition of U.S. Treasuries has been exuberant. The Federal Reserve’s Quantitative Easing (QE) assumed a prominent role (Figure 13).
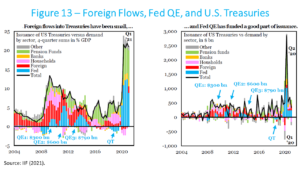
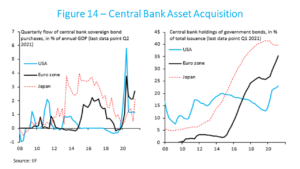
Figure 14 shows how central bank sovereign bond purchases and holdings have also been significant in the euro zone and Japan.
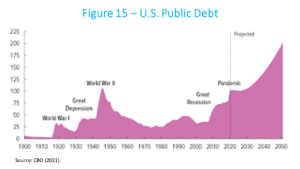
Since the global financial crisis, there has always been an open discussion on whether, in many advanced economies, the fiscal space for expansionary policies has been underutilized (Kose et al, 2013) (Canuto, 2021a). While real interest rates remained low, higher public spending might have entailed GDP growth rates high enough to eventually lead to declining public-debt-to-GDP ratios. As well established by Blanchard (2019), as long as there is no major change in the perception of government default risks, public debt-to-GDP ratios would not rise if GDP growth rates remained higher than interest rates. Whether less than potentially or not, fiscal deficits and public debt have cushioned current demand and asset gaps (Figure 15).
This process is likely to leap ahead in the U.S. with the Biden administration’s fiscal stimulus plans, both on expenditure flows (via fiscal deficits) and on stocks of household assets (via public debt) (Canuto, 2021b). Nevertheless, such a scenario depends on interest rates not rising substantially, otherwise asset prices, already thin in terms of price-earnings ratios, and risk profiles would crumble.
Is “the age of secular stagnation drawing to a close?” (Subramanian, 2021). While any chronic insufficiency of aggregate demand—or lackluster potential growth—may be mitigated as President Biden’s fiscal packages are implemented, the issue of a mismatch between creation of new assets and financial wealth accumulation may well return to the fore later if the recent secular stagnation trend in net investments to GDP is not altered, with public debt at much higher levels. It will all hinge on overcoming—or not—structural trends of low investment ratios to GDP.
- Concluding Remarks
The U.S. big balance sheet economy is on a growth path highly dependent on the continuity of low real interest rates, as well as stretched price-earnings ratios of stocks and high corporate debt. Periodic episodes of downward adjustment of asset prices and balance-sheet tensions have been countervailed with lax monetary policies.
Fiscal deficits and public debt can extend the life span of such dynamics in two ways. First, fiscal deficits can boost the return of private assets by lifting profits and stimulating the creation of new assets. Second, higher public debt widens the outlays to accumulate private financial wealth.
In the absence of fiscal deficits and public debt expansion, the underlying mismatch between financial wealth and the real-side economy comes to the fore. And ultimately the impact of fiscal policies will depend on the extent to which it translates into lifting the accumulation of new productive assets.
Apart from occasional asset-price and balance-sheet adjustments, accompanied or not by financial crises, the extension of the finance-led macroeconomic growth will depend on the extent to which factors leading to the relative insufficiency of new productive assets are reversed, while interest rates remain low. Otherwise, the U.S. economy will stay on a bubble-led growth-cum-cycle trajectory, with moments of—highly or lowly disruptive—financial stress.
How to increase the supply of real assets? If the technological hypothesis about secular stagnation is strong, there is not much that can be done beyond hoping that ‘green infrastructure,’ for instance, plays a Schumpeterian creative destruction role, scrapping the value of old infrastructure while bringing in new physical asset creation. The intensity of intangible assets in new technological frontiers—and thereby lower multiplier-accelerator effects as compared to previous technological revolutions—is unlikely to change. Demography also looks plausible as a factor. Income distribution—assuming it can be done, and in ways not incompatible with the system’s dynamics—would help.
How about tightening monetary policy, regardless of inflation being a motivation or not, to deflate the bubble and bring the economy back to a lower, more stable, and more sustainable growth path? That would lead to a huge and wide asset-price crash, highly likely with illiquidity turning into insolvency of many balance sheets. Followed by growth rates even lower than the ones of the recent past. Japan has been a prequel…
Would the financial dominance in the US be related to the outsized role of the high-tech sector in the US, its low real asset intensity, its scale economies, and its reach in an integrated global economy? The first recent big bubble (the dot.com) would be compatible with this possibility, even though its size and weight were then small as compared to nowadays, when they exacerbate the scarcity of fixed-investment assets. However, one should not lose sight of ‘financial development’ moving finance ahead of regulators (like in the housing bubble). The eternal cat-and-mouse game since the beginning of full development of market economies!
To different degrees, most advanced economies face the issue of what to do with respect to financial wealth dynamics in excess of domestic private real-side investment dynamics. As we have considered in other articles, Southern non-advanced economies would be a natural outlay to receive that excess financial wealth, provided that appropriate policy homework is done in those countries (Canuto, 2021a, 2021c).
References
BIS – Bank for International Settlements (2021). Quarterly Review, June.
Blanchard, O. (2019). Public Debt and Low Interest Rates, American Economic Review, Vol. 109, No. 4, April. pp. 1197-1229.
Brooks, R.; Fortun, J.; and Pingle, J. (2021). Global Macro Views – The US Yield Conundrum, Institute of International Finance, June 17.
Canuto, O. and Ghosh, S. (eds.), Dealing with the Challenges of Macro Financial Linkages in Emerging Markets, World Bank, Washington DC Canuto, O. (2020).
Canuto, O. (2021a). Climbing a High Ladder – Development in the Global Economy, Policy Center for the New South.
Canuto, O. (2021b). A Possible Tug-of-war Between the Fed and the Markets, Policy Center for the New South, March 25.
Canuto, O. (2021c). Matchmaking Private Finance and Green Infrastructure, Policy Center for the New South, July 7.
CBO – Congressional Budget Office (2021). The 2021 Long-Term Budget Outlook, March.
Cowen, T. (2013). Are real rates of return negative? Is the “natural” real rate of return negative?, Marginal Revolution, November 18.
Furman, J. and Summers, L. (2020). A Reconsideration of Fiscal Policy in the Era of Low Interest Rates, Peterson Institute of International Economics, November.
Gordon, R. (2014). The Demise of U.S. Economic Growth: Restatement, Rebuttal, and Reflections, NBER Working Paper 19895, February.
IMF – International Monetary Fund (2021). Global Financial Stability Report, April, ch. 2
Keynes, J. M. (1937). The General Theory of Employment, Quarterly Journal of Economics, vol. 51, No. 2 (Feb.), pp.209-223.
Kim, K.Y.; Lima, G.T. and Setterfield, M. (2019. Political aspects of household finance: debt, wage bargaining, and macroeconomic (in)stability, Journal of Post Keynesian Economics, 42:1, p. 16-38.
Koo, R. (2011). “The world in balance sheet recession: causes, cure, and politics”, Real-World Economics Review, issue no. 58.
Kose, M.A.; Lougani, P.; and Terrones, M. (2013). Why is this global recovery different?, VoxEU, 18 April.
Krugman, P. (2013). Bubbles, Regulation, and Secular Stagnation, New York Times, September 25.
Lall, S. and Zeng, L. (2020). Intangible Investment and Low Inflation: A Framework and Some Evidence. IMF Working Paper WP/20/190, September 18.
Levy, D. (2019). Bubble or nothing, The Jerome Levy Forecasting Center LLC, September.
Minsky, H. P. (1986). Stabilizing an Unstable Economy, McGraw-Hill Education.
Subramanian, A. The age of secular stagnation may be drawing to a close, Financial Times, June 30.
Summers, L. (2013). Economic stagnation is not our fate — unless we let it be, Washington Post, December 18.
Wolf, M. (2020). How to escape the trap of excessive debt, Financial Times, May 5.
Otaviano Canuto, based in Washington, D.C, is a senior fellow at the Policy Center for the New South, a nonresident senior fellow at Brookings Institution, a professorial lecturer of international affairs at the Elliott School of International Affairs – George Washington University, and principal at Center for Macroeconomics and Development. He is a former vice-president and a former executive director at the World Bank, a former executive director at the International Monetary Fund and a former vice-president at the Inter-American Development Bank. He is also a former deputy minister for international affairs at Brazil’s Ministry of Finance and a former professor of economics at University of São Paulo and University of Campinas, Brazil.
Original: Policy Center for the New South, August 2021, PB-21/29
* The author wishes to thank Uri Dadush, Abdelaaziz Aitali, Isabelle Tsakok, and Gilberto Tadeu Lima for comments on an earlier version, without implicating them in any way.