Policy Paper at the Policy Center for the New South
By Otaviano Canuto and Christos Daoulas
This note approaches the relationship between natural wealth and economic growth, using the case of Sub-Sahara African economies as an illustration. Delving into recent World Bank reports, it highlights how a sustained positive correlation between natural capital and GDP growth happens through the transformation of the former into other forms of assets: produced capital, human capital and other intangible assets. Governance features and the quality of macroeconomic policies are of the essence for such a benign trajectory to take place.
- Economic Development as a Process of Capital Accumulation
Economic development is, at heart, a process of building wealth, of accumulating and managing a portfolio of assets that make possible sustainably rising levels of GDP. However one defines development, it supposes rising income levels and an underlying process of building stocks of capital.
As such, the complete asset base of countries and its lifespan serving as the foundation for future income generation need to be employed alongside per capita GDP growth in the measurement of the development process and its outlook. As GDP per Capita captures quality of living, wealth captures the potential of countries to maintain these standards in the short and long term (Lange et al, 2018).
A common pitfall of measuring development lies in not duly taking the role of natural resources as a component of that capital stock into account, i.e. the fact that their quantity and quality is among the determinants of a country’s potential GDP. Furthermore, one must reckon the fact that the use of depletable natural resources must be outweighed by the accumulation of other forms of wealth if the capital stock available for future GDPs is to increase or even maintained.
The World Bank has since the mid-1990s developed an appraisal of national accounts, covering a full spectrum of assets that comprise the wealth of nations and includes natural resources. The latest report – The Changing Wealth of Nations 2018 – compiled wealth data for 141 countries from 1995 to 2014, summing estimates of four distinct wealth classes (Lange et al, 2018):
(i) Produced Capital and urban land: machinery, buildings, equipment, and residential and non-residential urban land, at market prices
(ii) Natural Capital: both non-renewable and renewable resources, such as energy (oil, gas, hard and soft coal), minerals, agricultural land (cropland and pastureland), forests (timber and some non-timber forest products), protected areas;
(iii) Human Capital: the value of skills, experience, and education, measured by discounting the future value of earnings over the lifetime of the labour force, and disaggregating by gender and employment status (employed, self-employed)
(iv) Net Foreign Assets. national external assets including portfolio equity, liabilities, foreign direct investment and other financial capital held abroad (Lange et a., 2018).
The relationship between wealth and GDP reflects the local development of a wider asset class that one may refer to as Intangible Capital or Assets or Wealth, highly correlated with human capital but referring to what the previous World Bank report called as “measures of social and institutional capital, which comprise factors such as the rule of law and governance that contribute to an efficient economy” (Lange et al, 2011, p. 4-5). It is meant to include the entire set of variables that have an impact on the degree of efficiency under which an economy develops, i.e. rules and institutions that may either support or impose costs and waste on chains of transactions among economic agents.
Intangible wealth may also be taken as encompassing the local development of capabilities, at various levels of aggregation (firms, sectors, economy-wide): managerial, design and organizational capabilities; capability to adapt technologies and innovate; etc. As in previous World Bank reports on the subject, Intangible Assets may be taken as responsible for explaining levels of GDP that cannot be fully accounted for by natural wealth and accumulation of produced capital (“the measure of our ignorance”)
- Changing Wealth of Nations (1995-2014)
According to the latest World Bank stock-taking exercise – (Lange et al, 2018) – global wealth has grown by a whopping 66% from 1995 to 2014 (Table 1), with middle-income countries gaining up on higher-income economies. In fact, more than 24 of middle-income countries in 2014 were cases of successful transition from low-income status during the period examined.
Table 1 reproduces the aggregate figures of wealth and per capita wealth by type of capital and income group in 1995 and 2014, while Figure 1 displays such figures for 2014. While individual country cases will differ according to different levels of natural wealth, one may establish some common trends concerning the weights of each asset class as an economy typically climbs the ladder from low- to higher-income levels. Figure 1 may be seen as a cross-section picture of an average country’s potential transitions over time (Canuto and Cavallari, 2012).
Three broad features may be highlighted:
Firstly, the weight of Produced Capital – physical capital – stabilizes in relative terms after the ascent from low-income levels. The share of produced capital in wealth moves upward from low levels in low-income countries but remains reasonably modest thereon. Figures for lower-middle-income countries in the period covered by the table are heavily influenced by the weight of China and its extraordinarily fast pace of produced capital accumulation (Canuto, 2013, 2019a). The ex-China subgroup displays numbers closer to a smoother evolution. It appears that cumulative savings used for investments in physical assets accompany and support the rise in income levels, but typically at a proportionate speed.
Table 1. Wealth and Per Capita Wealth by Type of Capital and Income Group, 1995 and 2014
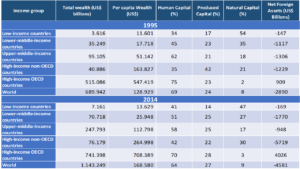
Source: Lange et al (2018)
Figure 1 – Composition of Wealth, 2014
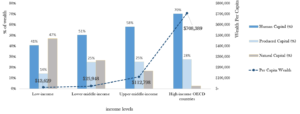
Source: Lange et al (2018)
Secondly, Human Capital plays a high and increasing weight. Human capital – and intangible wealth – is a major component of total wealth at all levels of income, but increasingly so as the economy moves to the upper-middle- and high-income levels. Increased educational attainments, as well as improvements in institutions, governance, and other intangible forms of wealth are imperative if a country is to keep climbing the income ladder.
The nexus with savings and investments is not as straightforward as in the case of produced capital, because the dynamics of both human capital and intangible wealth accumulation—or depletion—depend to a large extent on factors of another nature (quality of education; institutional evolution; capabilities and collective knowledge tacitly embedded in routines of firms, the public sector, organizations, and other social groups; and non-research-and-development-derived technical progress).
Human Capital is the principal constituent of total wealth and increasingly correlated with growth in middle and even more significantly in higher-income levels, notwithstanding being partially overshadowed by Natural Capital in the low-income country bracket. Human Capital is instrumental in paving the way to higher income. By fortifying early childhood development and ensuring minimum primary and secondary education, barriers to educational attainment are broken and learning outcomes raised, accompanied by consequent increases in the intrinsic value of knowledge and skills that is translated into higher wages for workers.
Human development goes hand in hand with initiatives aimed at improving health and expanding the labor force; spending in social services and life-sustaining infrastructure, targeted at nurturing well-being and supporting population growth, by increasing life expectancy and countering famine and child mortality, are necessary, while the role of infrastructure is also equally decisive in offering market outlets for labor (Izvorski et al, 2018). Apart from resource rent investments, Human Capital may also be boosted by policies cultivating gender equality in labor force and education participation for women, increasing female returns (Agenor & Canuto, 2015) (Lange et al, 2018). Finally, Human Capital goes hand in hand with the local development of production and technological-learning capabilities (Canuto, 2018).
Table 1 shows Human Capital, on average, almost matching Natural Capital in composition levels among low-income countries in 2014. Much of the convergence in Wealth between 1995 and 2014 is largely attributable to accumulation of Human Capital, as investments in education and health were substantial in many low and middle-income countries, besides institutional and technological changes that supported their growth along globalization (Lange et al, 2018) (Canuto, 2017).
Thirdly, regardless of country-specific natural resource richness, the weight of natural wealth is higher on the transition from low- to middle-income, but then decreases relatively along the ascent towards high-income. It follows from the previous two remarks – as we can also observe by looking at Table 1 and Figure 1 – that the single most important constituent of Total Wealth in Low-Income Countries is Natural Capital, only decreasing in relevance through direct substitution by Produced Capital and predominantly by the effect of the accumulation of Human Capital and Intangible Assets, as countries progress towards higher income echelons. The mechanism that underlies this process is dependent on labor transfer, as typically a large pool of unskilled subsistence-level workers makes the transition toward more modern capital-intensive occupations in more modern activities with higher embedded technology; this technology is often diffused from richer countries and easily adaptable to local circumstances with minimum capabilities of imitation and adaptation, without entailing significant skill recalibration requirements from workers in order to be deployed.
Natural Capital is itself combined with production capabilities, particularly when the natural-resource use is to a large extent idiosyncratic, as each extraction process is unique and high cost subsoil deposits are addressed predominantly through the development of local capabilities in sophisticated upstream and downstream activities. These requirements in terms of capabilities will vary and may surpass the imitation and adaptation that were sufficient in labor transfers from subsistence to more modern activities pointed out as typical of the transition from low- to middle-income countries. Creative absorption or innovation may be necessary, as the creation of specific content – that cannot be perfectly diffused through public information or private property, or emulated based on textbooks, blueprints, or other codifiable forms of knowledge transmission – is required to be developed locally in order to enable higher quality and more efficient domestic commodity production (Brahmbhatt et al, 2010; Canuto, 1995; Canuto et al, 2010).
Natural Capital intermingles with the institutional component of intangible assets, as a scrutinized resource management process, together with transparent fiscal and macroeconomic stability policies may direct natural resource rent surpluses towards viable investments on one hand, whereas policies focused on fostering a favorable business and investment climate may incite risky entrepreneurs to innovate on the other, thus furthering the development of both Intangible Wealth and Produced Capital (Brahmbhatt et al, 2010; Canuto, 2019b).
Natural capital also varies over time for reasons other than its use. The fact that it decreases in relative terms as a wealth component when the economy moves up the income ladder does not preclude it to rise in absolute terms as a result of technological changes or new discoveries.
Values of natural capital may also change as a result of heterogeneity among natural resources. The value of existing assets may rise if increases of global production must be based on less efficient sources at the margin. Such “rents” tend to be reflected in the value of natural capital in countries well-endowed with high-quality resources.
- Natural Resource abundance: opportunities come with challenges
One may then presume that abundance of natural capital—as measured by per capita natural wealth—is in principle favorable to raising per capita income levels. Furthermore, the average archetype of wealth-cum-income progression depicted in Table 1 may take place with different shares of natural wealth in different countries. This is illustrated by the different wealth compositions as of 2014 among high-income countries (the United States, Japan, Norway, Canada, and Australia), as well as among middle- and low-income countries (Table 2). Figure 2 also shows no clear correlation between shares of natural wealth in total wealth and per capita income. Fourteen countries with annual GDP per capita above $35.000 had in 2014 shares of natural capital ranging from almost 0 % up to 79 %.
Differences in quantity and quality of natural resources may also explain why countries with different levels of technological achievement can have similar income levels. The World Bank (2007) developed country indexes of technological achievements and showed their (nonlinear) relationship with income levels (Figure 3). On the other hand, many countries in Latin America and the Caribbean managed to reach middle-income levels with much less technological effort than others. Produced capital does not seem to explain such a discrepancy and, apart from non-technology-related intangible wealth, the high quality of known natural resources in the region—large swaths of arable land and mapped sources of oil and minerals—may well be among the explaining factors.
Table 2 – Wealth and Natural Capital Per Capita, 2014 (Selected Countries)
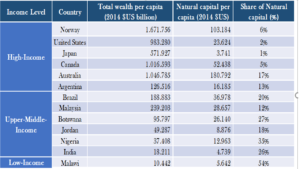
Source: Lange et al (2018)
Figure 2 – Natural Capital and GDP Per Capita – 2005
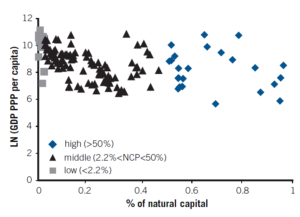
Source: Canuto and Cavallari (2012)
Figure 3 – Technological Achievements Rise with Income Levels
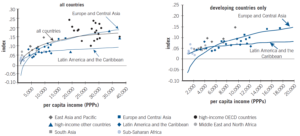
Source: World Bank (2007, p. 84)
However, natural-resource dependence exposes economies to several challenges. High reliance on natural endowments as predominant sources of income and exports means that they are also highly vulnerable to accompanying commodity price volatility. This effect is often magnified by domestic factors as well, such as resource extraction and exploitation that may lead to early depletion, or unrestrained spending of derived resource revenues directed towards public consumption and patronage purposes rather than building produced and human capital. Thus, price shocks and resource mismanagement in resource dependent countries may hinder a sustainable future growth for national income and evidently raise the possibility of natural resources becoming a curse rather than a blessing (Brahmbhatt et al, 2010) (Canuto and Cavallari, 2012). The possible downsides nevertheless highlight the importance of a diversified investment strategy inclusive of non-resource reliant activities within developing countries, as a necessary condition to counter negative long-term development trends in the case that those challenges associated with resource over-dependence render developing countries susceptible to poverty and middle-income traps.
Governance and economic policy challenges
There have been cases in which natural resource discoveries or appreciations, instead of being followed by a transformation of natural capital into other forms of productive wealth through some virtuous process of savings and investment, were accompanied by stagnation or even income regression, generally in combination with political disruption. Brahmbhatt et al (2010) explain how certain conditions could result in situations where natural resource booms become a curse. Weak governance and corresponding poor economic policies underlie the misallocation and mismanagement of resources. Resources shift out of productive activities into unproductive rent-seeking activity when, for example, patronage networks are strengthened with their appropriation of fallen-from-heaven rents. It is not by chance that resource curse cases can be primarily associated with extractive industries (oil, gas, and minerals) because these are “concentrated ‘point source’ resources that can easily become the object of rent-seeking and redistributive struggles” (Brahmbhatt et al, 2010, p. 107), a point originally made by Collier and Goderis (2007).
Consumption use of tax revenues derived from natural resource extraction through public spending is also a typical manifestation of poor governance. In fact, the handling (whether good or bad) of macro-management challenges that typically accompany natural resource booms in natural resource–rich countries (volatility, risks of overborrowing, and crowding out of intangible wealth-intensive manufacturing) can in most cases be traced back to governance quality. Natural resource curses may thus be associated with governance traits that either precede the boom or emerge with it.
Collier and Venables (2009) cite two main reasons that feed perceptions of resource abundance as a curse, focusing on resource exploitation that may lead to national income degrading effects. First, resource abundance may offer openings for “looting” from the incumbent government: corruption, theft and insurgency render a fragile political environment that damages democratic institutions. Resource rents resulting from commodity booms may thus be captured, either by pressured or corrupted political elites, who can completely subvert these rents for their own personal benefit. Second, resource abundance may reduce the accountability of the government, as citizen scrutiny is substituted by politically endorsed and uncontrolled government spending aimed at pleasing patronage networks. With instances such as rapid employment expansion, regardless of its long-term sustainability, political elites manage to stay in power after elections; in this manner, resources are no longer productively destined towards public investments, but unproductively employed in rent-seeking activities and redistributive struggles instead, even triggering armed conflict on the extreme side of the exploitation spectrum as well.
Threshold effects are at play:
“Below a certain level of institutional development, resources have a negative effect, while above it, affects are absent or may be positive (…) Countries with good governance (…) are able to afford the human development and institution building expenditures and move them onto an upward path” (Collier and Venables, 2009: 9)
The Adjusted Net Savings (ANS) rate is a development measurement method complementary to changes in national wealth (Lange et al, 2018). ANS is calculated as Gross National Savings plus Education expenditures, minus Fixed capital consumption, Pollution Damage costs and Natural Resource Depletion. A negative ANS thus serves as a warning sign of capital stock reduction, as it captures an unsustainable economic path, evidently providing policy stakeholders with important feedback to shape initiatives aimed at restoring long-term growth.
Over-reliance on natural resources
Lack of production diversification may also hinder the development process in a double, interrelated fashion, leading to poor economic performance in the long run, mainly due to institutional factors spearheaded by poor economic and political governance: (i) inefficient economic policies, specifically weak fiscal policies regarding resource rents, combined with feeble countercyclical macroeconomic stability measures, in the wake of – and during – commodity price booms; and (ii) unchecked natural asset exploitation that may lead to resource rent capture or even resource depletion.
As far as poor economic policies in resource-rich countries are concerned, domestic factors revolve around macroeconomic mismanagement that is grounded on inefficient fiscal policies, preceding and following manifestations of external commodity price volatility, which may exacerbate both significant misallocation of resources and higher risks associated to uncertainty of outcomes from investment and, thereby, negatively affect asset building and economic growth. Commodity booms are only one of the facets of commodity price volatility; as a result, an overall reduction of productivity in non-resource sectors ensues, consequently undermining economic performance, sometimes even in economies with good governance and institutions facing commodity price booms and more so in countries who lack them.
The underlying mechanism of this destabilising procedure is the “Dutch Disease” economic effect, that occurs when a financial windfall stemming either from a recent resource discovery, or a commodity price boom originating in international markets, is considered as permanent by the economic agents involved; these unreasonable expectations spearhead structural changes in production, such as price jumps in non-tradable (e.g. services) and contraction or stagnation in non-resource tradable (e.g. manufacturing) industry sectors, accompanied by a real exchange rate appreciation. “Dutch Disease” thus inevitably raises real exchange rates followed by a crowding out of intangible wealth-intensive manufacturing, as an aggregate of two main effects: (i) the spending effect, where resource rents increase domestic consumption, causing inflation in non-tradable sectors and losses in the non-resource tradable ones; (ii) a resource movement effect, that also causes inflation in non-tradables due to decreased output resulting from capital and labour mobility toward booming natural resource sectors (Brahmbhatt et al, 2010).
Particularly vulnerable to Dutch Disease are oil and minerals, concentrated “point source” resources that can easily be captured by elites, as opposed to booms concerning agricultural commodities, whose production regime may take place under conditions of more contestable market structures. Although the resulting higher incomes and increased purchasing power stemming from natural wealth increases may enable domestic consumers and stimulate public spending in development, Dutch Disease effects can however become a concern, when considering that non-resource tradable sectors characterized for their potential to support long-term growth via technological diffusion, idiosyncratic learning-by-doing and economies of scale may be negatively affected by persistent real exchange rate overvaluation (Brahmbhatt et al, 2010).
The opposite facet of macroeconomic mismanagement associated with commodity price volatility relates to commodity price busts. Whereas booms may uncontrollably drive government spending and real exchange rates upwards, commodity price shocks may cause debt crises, in a two-fold manner. Firstly, short-term wise, the Dutch Disease effect during commodity booms may stimulate over-borrowing from abroad, as a means to fund ambitious public investment and consumption endeavours; this tendency has often led borrowing resource-abundant countries towards balance-of-payments crises and unsustainable external debt levels, furthering economic destabilizing effects of commodity price busts. Long-term oriented problems for resource-abundant countries caused by commodity price shocks refer to the optimal pace of concurrent resource depletion and rent saving for the social welfare of future generations.
It is critical to note that the actual extent of Dutch Disease effects, volatility, and over-borrowing will depend to a large extent on policies—for example, on the extent to which cautious fiscal policies are able to moderate aggregate demand pressures, smooth volatility in government revenues, and curb external over-borrowing. Overall, pro-cyclical fiscal policies and weak political governance support rent capture and poor public finance management that do not envisage necessary fiscal buffers to smoothen governmental spending during commodity booms and busts. As such, it becomes evident that weak institutions are detrimental for growth in resource-abundant developing countries.
Natural-resource curses may happen along the income ladder
The high weight of natural capital in national wealth typically found in low-income countries may lead one to expect the relevance of the challenges associated with resource abundance to be circumscribed to them. Nevertheless, one must notice that in most cases of middle-income countries that have faced difficulties to climb up the income ladder – and are “trapped” (Canuto, 2019) – governance and economic policy still carry features that hurt their effort to reach the top. There is always a possibility even of backward moves:
“Individual middle-income country experiences of falling into a “trap” may be approached as cases of lack of or failing performance in footing the bill in terms of appropriate policies and institutions” (Canuto, 2019).
Take, for instance, Brazil’s recent experience after the sudden discovery of oil discovery in overseas pre-salt layers, at a moment in which oil price were hovering above US$ 100 a barrel. Under prevailing governance conditions, the perception of fallen-from-heaven richness favored a massive wave of corruption events and wide misallocation of public resources, the consequences of which have been felt along the aftermath of a deep economic crisis, followed by weak economic recovery since 2015 (Canuto, 2017).
- Natural Capital and Economic Growth in Sub-Saharan Africa
In this section, we resort to Izvorsky et al (2018) and Lange et al (2018) to illustrate the conceptual framework of natural resource-focused national wealth with cases drawn from Sub-Saharan Africa (SSA). With at least 250 million inhabitants in resource-rich African countries, natural assets are responsible for more than 80% of exports and 50% of government revenues (Collier and Venables, 2009); as such, the high concentration of resource-rich countries in the area allows for direct comparisons with their resource-poor counterfactual regional neighbors.
Resource-rich SSA countries have recently exhibited the highest rates of economic growth since 2000, rekindling their path of convergence with higher income economies. The region’s growth has been predominantly resource-driven: growth was boosted by new natural asset discoveries and accompanying expectations for commodity price booms. As such, a substantial proportion of this development is owed to the subcontinent’s resource abundance: resource-rich SSA countries demonstrated higher growth rates compared to their resource-poor neighbors since 2000 and even 0,25% more than their resource-rich counterparts elsewhere, spearheaded by Angola and Nigeria, albeit lagging during the commodity bust of 2015-16 (Figure 4).
Figure 4 – Growth rates of GDP per capita in SSA
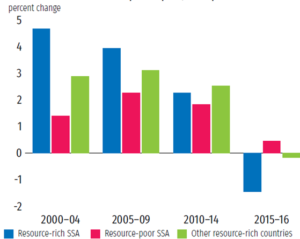
Source: Izvorsky et al (2018)
Note: The values in these figures are unweighted averages of per capita growth. Other resource-rich countries include the top 30 countries in terms of natural capital per capita, excluding the four African countries in the top 30 (Angola, the Republic of Congo, Equatorial Guinea and Gabon).
This is evidenced by the lead of resource-rich countries in access to education and years of schooling, whereas life expectancy has been significantly increased as well. On the other hand, resource-rich SSA countries have not been as successful in inducing rapid poverty reduction rates; poverty in resource-abundant countries fell only by 9% compared to a 15% decline experienced in the resource-poor ones in the 2000s (Figure 5).
Figure 5 – Poverty Comparison between resource-rich and –poor SSA countries
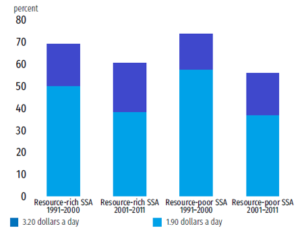
Source: Lange et al (2018)
Although the quality of life has overall improved, challenges in increasing the pace of growth remain. National wealth in resource abundant SSA is comparable to the South Asia Region (SAR), but behind other developing regions. Human capital in SSA is just 25% of its Middle East & North African (MENA) equivalent; although education spending in SSA surpasses 4% of GDP, average years of schooling, learning outcomes and health spending-to-GDP ratios are still low in resource-rich SSA countries as compared to the resource-poor, with predictably detrimental effects on the development of labor skills. Total Factor Productivity (TFP) in SSA, although accounting for half of economic growth rates in the early 2000s due to improved resource exploration and extraction methods, later became more modest in resource rich SSA; in addition, SSA physical infrastructure is the lowest in the developing world.
Regarding natural wealth, the natural asset growth gap has widened between SSA countries and their income-level counterparts in MENA, SAR, East Asia and the Pacific (EAP), Latin America & the Caribbean (LAC) and the advanced economies in Europe (Figure 6). Despite being regarded as having – mostly undiscovered – resource abundance, with resource-rich countries in the region accounting for 70% of the subcontinent’s GDP and Produced Capital, 60% of its Natural Capital and approximately 40% of its population, contemporary subsoil discoveries have been moderate, whereas agricultural yields fared even shorter of expectations and global averages, with an ensuing decline of 10% in value added. This result is particularly disturbing, especially considering that with 200 million hectares, SSA is endowed with nearly half of the world’s uncultivated land that has yet to be put into production. Consequently, the aggregate value of SSA’s resource wealth has remained unchanged for more than two decades, with per-capita natural income levels just over those of SAR, but nevertheless still behind all other developing regions’ equivalents.
Figure 6 – Increase of Wealth by Asset Type and Geographical Region, 1995-2014
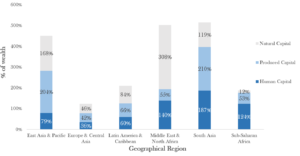
Source: Lange et al (2018)
What could account for such a discrepancy? As previously discussed, natural wealth growth either piggybacks on international appreciation, or reflects exploration activities supplemented by development of relevant extraction procedures and other uses of resources. The latter, being a domestic and country-specific factor, may only fall into place after inciting considerable foreign fixed investment interest in domestic natural endowments; thus, institutions ensuring de-risking macroeconomic policies, political stability and an attractive business and investment environment for extractive companies matter.
However, despite the salience of exploration and extraction for development, the institutional picture is not so endearing in the case of SSA: In resource-rich SSA countries, the quality of institutions is lower than that of their counterparts in other regions and even resource-poor neighbors in the same region, especially on terms of property rights and rules-based governance (Figure 7). With low additional levels of productive wealth, low institutional quality obstructs the delivery of public services, as well as the development of an investment and business climate conducive of natural wealth growth. According to World Bank Governance indicators, resource abundant SSA countries face serious problems in all institutional dimensions, especially on the most prominent growth areas: government effectiveness, rule of law and regulatory quality. These institutional restrictions must be dealt with in order to increase the value of natural endowments through the discovery and development of additional resources.
Figure 7 – Governance Indicators compared, 2014
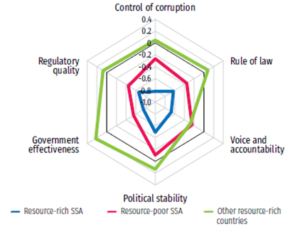
Source: World Governance Indicators (World Bank), Lange et al (2018)
Note: Governance Indicators rank from -2,5 (weak) to 2,5 (strong)
The challenge for political leaders and economic policy makers is evidently to follow policies leading to substantial asset building on two levels: a national level, boosting human, production and institutional capital; a cross-border level, advancing regional commercial integration. If the low availability of these fundamental national wealth tangible and intangible components is not addressed, SSA’s current capital and institutional endowments will be inadequate to achieve a sustainable growth rate necessary for more significant socioeconomic development. As such, on the national level, resource abundant SSA countries must find their income transition on concurrent intangible and physical capital accumulation, in order to maximize the value of their existing discovered and undiscovered natural assets.
A major challenge remains to establish a good management of natural resource rents through counter-cyclical fiscal policy. Reliance on commodity rents has been linked to a worsening of fiscal balances: despite flexible fiscal stimuli introduced during the 2008-09 crisis and the end of the 2014 commodity boom, fiscal policy has been pro-cyclical, subjecting the subcontinent economy to commodity price volatility, over-borrowing and uncontrolled government spending, particularly experienced in the cases of Angola and Nigeria. Poor fiscal policies have also directed resource rents into productive wealth inefficiently, pushing ANS rate values below zero, although still much higher than the negative 10% mark reached in 1997. Just by raising the latter to resource-abundant OECD country averages of 8%, a $77 billion surplus might have been accrued by SSA economies. Accordingly, sound macroeconomic stabilization policies and counter-cyclical fiscal policies are of extreme importance, in order to ensure robust and efficient government spending, by offering a fiscal buffer during commodity price busts.
Figure 8 plots a relationship between average ANS from 1990 to 2014 and the wealth variation for a sample of SSA countries covered by Lange et al (2018). Although many—but not all—countries increased wealth per capita over time, the performance of the region lagged other parts of the developing world as we have already remarked. Some of the countries with negative ANS still scored gains in wealth. Even if negative ANS does not necessarily imply losses in wealth per capita over time, these countries could probably have achieved even higher gains in wealth with more sustained investments. ANS measurement complements figures on Wealth evolution
Figure 8 – Adjusted Net Saving and Change in Wealth
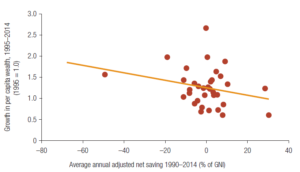
Source: Lange et al (2018)
Note: change in wealth = wealth per capita in 2014 divided by wealth per capita in 1995. GNI = Gross National Income
Several large resource rich middle-income SSA countries have introduced Natural Resource or Sovereign Wealth Fund (NRF) for this purpose, namely Angola, Botswana, Gabon, Equatorial Guinea and Nigeria, along with complementary fiscal rules and savings. Although promising, the results have so far been disappointing; in Angola the lack of guidelines between fiscal rules and limits to government withdrawal reduced the fund efficiency, whereas institutional arrangements in Nigeria did not prevent pro-cyclical fiscal policy during the recent boom. Contrarywise, well-managed NRFs, as evidenced by Chile in Latin America, may be very potent: during the boom experienced before the 2008 crisis, a high percentage of the windfall was saved in the country’s NRF (up to 12% of GDP by the end of 2008), allowing Chile to increase countercyclical spending even amidst financial reconstruction necessitated by a destructive earthquake (Brahmbhatt et al, 2010; Izvorski et al, 2018). As such, institutional building on economic governance is of prime importance to maximize government capacity, by increasing efficiency and effectiveness in government spending and public investment management, hence defending against resource price volatility.
On the production side, the contribution of labor in resource-rich countries is considerably lower as compared to the resource poor ones (Figure 9). Total Factor Productivity (TFP), which reflects human capital and other intangible assets, has expanded also considerably slower than in resource-poor neighbors. Building of idiosyncratic knowledge, infrastructure and an institutional environment conducive of risky and opportunistic entrepreneurship need to be boosted in order to raise local technological learning and productivity.
The improvement of infrastructure, principally in the energy sector, would also enable farmers to increase the productivity of the agricultural sector. Domestic production capability building would finally result from the combination of a business and investment climate that foster innovation and enhance domestic revenue mobilization; this combined effect would lead to a decline of investment rate volatility, supporting sustainable public and private investment. Foreign Direct investment levels in Africa – currently reaching only 2% of global flows – would eventually increase substantially and sustainably, promoting economic growth.
Figure 9 – Contributions of Productivity to Growth between Resource-rich and Resource-Poor SSA countries
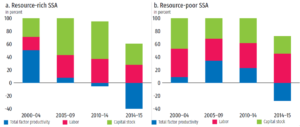
Source: Izvorsky et al (2018)
Note: Calculations used simple growth accounting (Solow model), δ=6%, α=40%. Unweighted averages of GDP growth rates are presented in these figures
On the cross-border level, regional commercial integration is a missing element of the intangible institutional capital needed to be strengthened for SSA countries to overcome low economic density, thick borders and long distances to world and regional markets. Despite access to international markets through commodity trade and plentiful integration agreements in place, resource rich SSA economies do not foment bidirectional economic spillovers to and from neighbor countries. Empowering such linkages – especially between the largest rich middle-income countries, namely Angola, Nigeria and South Africa – would increase the regional business appeal to domestic and international investors, hence increasing demand and concentrating value chains in regional economic hubs, by triggering a joint domino of distribution and demonstration effects. Possible paths would include reaping the advantages of low labor cost and reducing slack in domestic labor markets, akin to SAR’s experiences; appealing to foreign investors for the development of more advanced infrastructure and access to export routes; signing regional or international integration agreements, such as the Framework agreement establishing the African Continental Free Trade Area (CFTA) that may deepen regional integration.
Combining these elements of development would gradually but steadily strengthen institutional and production capabilities necessary for more robust growth. The path towards poverty eradication and improvement of living standards should be paved with improvements in levels and use of natural wealth, which is to be obtained by increased accumulation of non-resource types of capital, for both resource-poor and especially resource-rich SSA countries.
- Concluding Remarks
Resource abundant developing countries, although endowed with a unique mechanism to sustain high growth levels and sustain convergence toward higher income levels, are faced with a challenge: succumbing to fateful inner political workings that tend to lead to a natural resource curse; or transforming natural endowments into the pillar of a diversified investment portfolio, by achieving the right balance between the different national wealth components necessary for maximizing the blessing from the natural resource buck: Intangible Capital, Produced Capital and Natural Capital. The catalyst of the development process is Intangible Capital with a high quality of governance at its center, which enables expenditures in institutional, domestic capability and human capital building in an effort to maximize local development of public and private sector capacities. A business and investment environment conducive to local technological learning will facilitate the transition up the income ladder.
While the switch from low- to middle-income strongly depends on the accumulation of produced capital, income evolution from middle- to higher-income countries places intangible wealth at the spotlight, instanced with labor skilled through better education, governance institutional building and increased TFP through technological learning, as the pace of growth of produced capital stabilizes. Finally, as the importance of natural capital progressively diminishes – substituted by skilled human capital employed in more complex services and goods – production should diversify towards non-resource tradables and non-tradables, as opposed to being constrained solely to commodities, endorsing productivity and wage increases especially in SSA economies.
In resource-rich Africa, strengthening fiscal policy to ensure counter-cyclicality constitutes an essential ingredient for curtailing the complications of resource price volatility on government spending and Dutch Disease effects. Depending on the state of the resource abundant countries’ institutional development and capacity, emphasis should be increasingly placed on proper budget frameworks linked to prioritizing public investments into growing productive wealth and sound public finance management. Fiscal rules and NRFs are viable options when deployed efficiently, having served in many countries around the world as an anchor for policy, expectations, and discussions within the government and within society. It ultimately becomes apparent that in resource abundant economies, a healthy and environmentally friendly relationship between resource extraction, institutions and spending prioritization will pave the way for a brighter future, whose meritocratic nature will be efficiently scrutinized by the citizens themselves.
References
Agenor, P-R., and Canuto, O. (2015). “Gender equality and economic growth in Brazil: A long-run analysis”, Journal of Macroeconomics, Vol. 43, March, p. 155-172.
Brahmbhatt, M., O. Canuto, and E. Vostroknutova. 2010. “Natural Resources and Development Strategy after the Crisis”, in The Day after Tomorrow: A Handbook on the Future of Economic Policies in the Developing World, ed. O. Canuto and M. Giugale. Washington, DC: World Bank
Canuto, O. (1995). “Competition and endogenous technological change: an evolutionary model”, Revista Brasileira de Economia, vol. 49 (I), Jan.-Mar., p. 21-33.
Canuto, O., Dutz, M. and Reis, J.G. (2010). “Technological Learning and Innovation: Climbing a Tall Ladder”, in The Day after Tomorrow: A Handbook on the Future of Economic Policy in the Developing World, ed. by Canuto, O. and Giugale, M., World Bank. Washington, DC.
Canuto, O. and Cavallari, M. (2012). Natural Capital and the Resource Curse, Economic Premise n.83, World Bank, Washington, DC.
Canuto, O. (2013). “China, Brazil – Two Tales of a Growth Slowdown”, Capital Finance International, summer issue.
Canuto, O. (2016). “What’s Ailing the Brazilian Economy?”, Capital Finance International, winter issue.
Canuto, O. (2017). Overlapping Globalizations, Policy Brief PB-17/42, Policy Center for the New South, November.
Canuto, O. (2018). “Making Returns on Knowledge – How Innovation Can Flow from Globalisation”, Capital Finance International, autumn issue.
Canuto, O. (2019a). China’s Growth Rebalance with Downslide, Policy Brief PB-19/07, Policy Center for the New South, March.
Canuto, O. (2019b). Traps on the Road to High Income, Policy Brief PB-19/14, Policy Center for the New South, April.
Collier, P., 2011. The Plundered Planet: Why we Must — and How we Can — Manage Nature for Global Prosperity. Oxford University Press.
Collier, P., Venables, A.J., 2009. Natural Resource and State Fragility, European Report on Development. European Commission, Accra, Gana.
Izvorski, I., Coulibaly, S., Doumbia, D., 2018. Reinvigorating Growth in Resource-Rich Sub-Saharan Africa. Washington, DC., World Bank.
Lange, G.-M., Hamilton, K., Ruta, G., Chakraborti, L., Desai, D., Edens, B., Ferreira, S., Fraumeni, B., Jarvis, M., Kingsmill, W., Li, H., 2011. The Changing Wealth of Nations 2011: Measuring Sustainable Development in the New Millennium. Washington DC., World Bank.
Lange, G.-M., Wodon, Q., Carey, K. (Eds.), 2018. The Changing Wealth of Nations 2018: Building a Sustainable Future. The World Bank, Washington DC, World Bank.
World Bank (2007). Global Economic Prospects 2008. Washington DC., World Bank.
________________________
Otaviano Canuto is Senior fellow at the Policy Center for the New South and non-resident senior fellow at the Brookings Institution, and Christos Daoulas is a political economist about to become a Blue Book trainee in the European Commission.